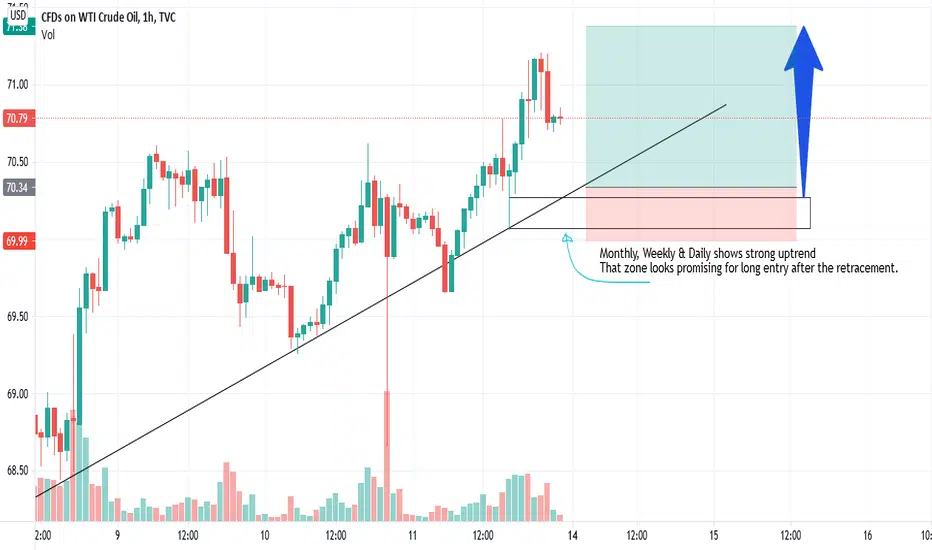
1. The monthly, weekly & daily shows strong up trend.
2. If you get down to 15 minutes chart you will find a clear zone that likely to reflect the price back up.
3. If you used the fixed range volume profile indicator at the last up wave at the 15 minutes chart you will spot a support line right above the zone identified.
4. The trend line as a support.
Disclaimer
The information and publications are not meant to be, and do not constitute, financial, investment, trading, or other types of advice or recommendations supplied or endorsed by TradingView. Read more in the Terms of Use.
Disclaimer
The information and publications are not meant to be, and do not constitute, financial, investment, trading, or other types of advice or recommendations supplied or endorsed by TradingView. Read more in the Terms of Use.