If you follow my charts, previously I noted that Visa would go to $150 and it went until $152. Congrats if you took the profit.
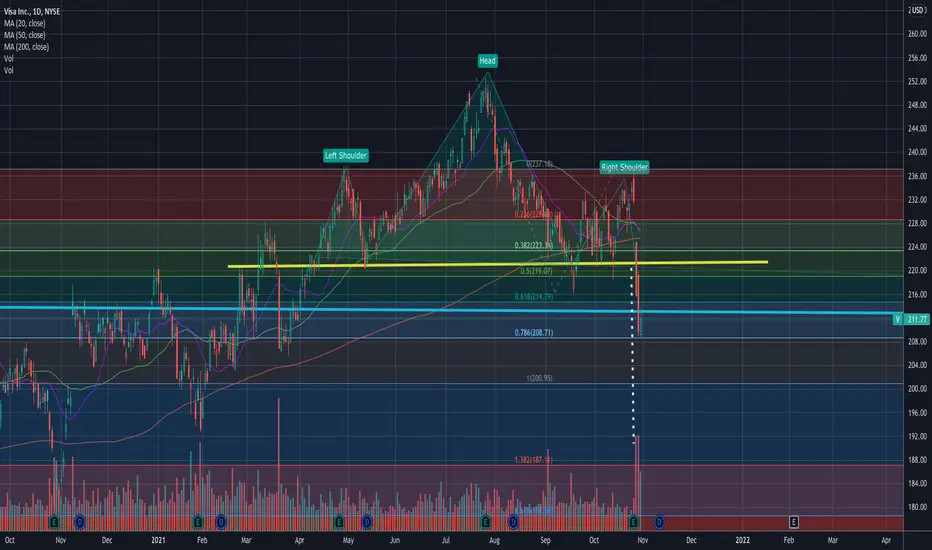
Now Visa just did the head and shoulder break down. The price bounced from 208ish which is around 50% of the breakdown target $192.
The 207 - 208 area is the fib support for both retracement as well as fib extension. It has also acted as previous support area from 12/2020 to 3/2021.
Patterns can reverse from 50% measured target.
Based on all these facts, I believe the bottom has been found.
It's still too early to call. But I have started my reentry.
Target 1 - $135
Target 2 - $150
Risk - fall below $207
———————————————————
How to read my charts?
- Matching color trend lines shows the pattern. Sometimes a chart can have multiple patterns. Each pattern will have matching color trend lines.
- The yellow horizontal lines shows support and resistance areas.
- Fib lines also shows support and resistance areas.
- The dotted white lines shows price projection for breakout or breakdown target.
Disclaimer: Do your own DD. Not an investment advice.
I am not a licensed professional. None of the posts that I published are investment advice. Do your own research.
Disclaimer
The information and publications are not meant to be, and do not constitute, financial, investment, trading, or other types of advice or recommendations supplied or endorsed by TradingView. Read more in the Terms of Use.