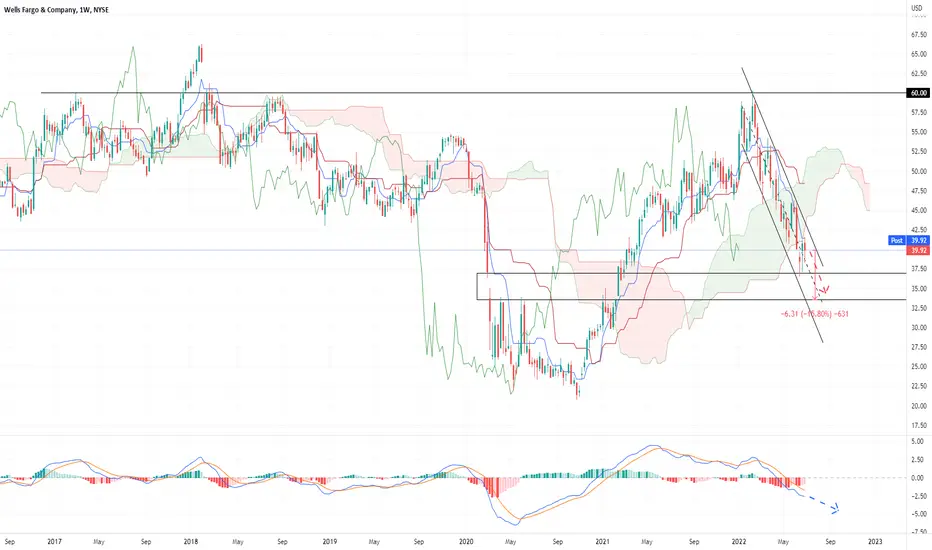
Wells Fargo stock chart on a week time scale highlights a bearish setup, that on a micro-level has been confirmed by the downward revised guidance issued by the bank.
In terms of the chart, becomes possible to see how both weekly candles have shaped a hanging man, with resistance at the Tenkan line, in a downtrend channel already where the stock price trendline,
has already confirmed the sell signal below the IKH Senkou A/B cloud.
Wells Fargo's stock price trendline should drift lower on $37>$33.50
Disclaimer
The information and publications are not meant to be, and do not constitute, financial, investment, trading, or other types of advice or recommendations supplied or endorsed by TradingView. Read more in the Terms of Use.
Disclaimer
The information and publications are not meant to be, and do not constitute, financial, investment, trading, or other types of advice or recommendations supplied or endorsed by TradingView. Read more in the Terms of Use.