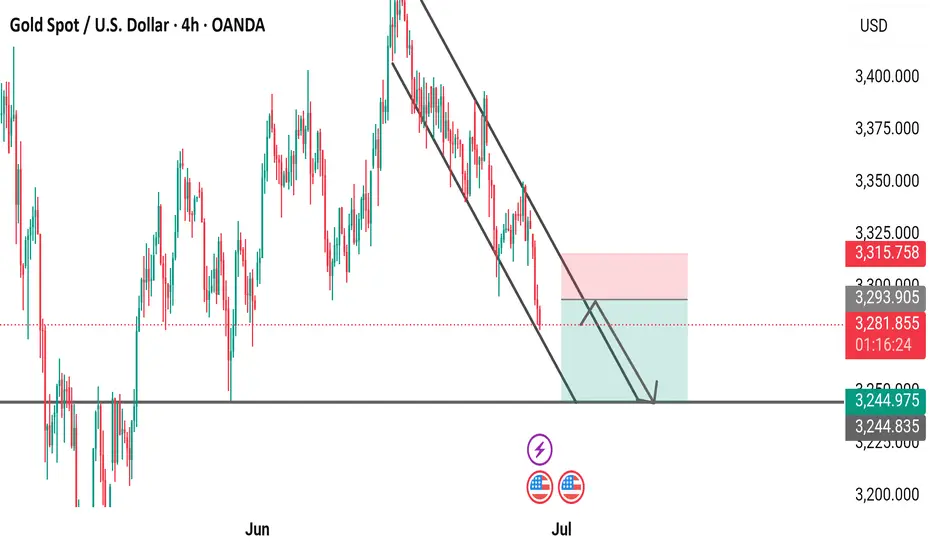
4-hour chart from OANDA shows the price movement of Gold Spot (XAUUSD) against the U.S. Dollar, with the current price at 3,282.135, reflecting a decrease of 45.685 (-1.37%). The chart includes a descending trendline, support and resistance zones (highlighted in pink and teal), and key price levels ranging from 3,244.835 to 3,400.000. The analysis suggests a potential downward movement as the price approaches a support zone near 3,244.975, with indicators like the U.S. flag and lightning bolt possibly signaling significant market events or volatility.
Daily XAU/USD FREE setups | Let's grow together!
| XAU/USD Trader | Telegram: https://t.me/Aleegoldsignals
| XAU/USD Trader | Telegram: https://t.me/Aleegoldsignals
Disclaimer
The information and publications are not meant to be, and do not constitute, financial, investment, trading, or other types of advice or recommendations supplied or endorsed by TradingView. Read more in the Terms of Use.