Here’s a brief description of what’s shown in the chart:
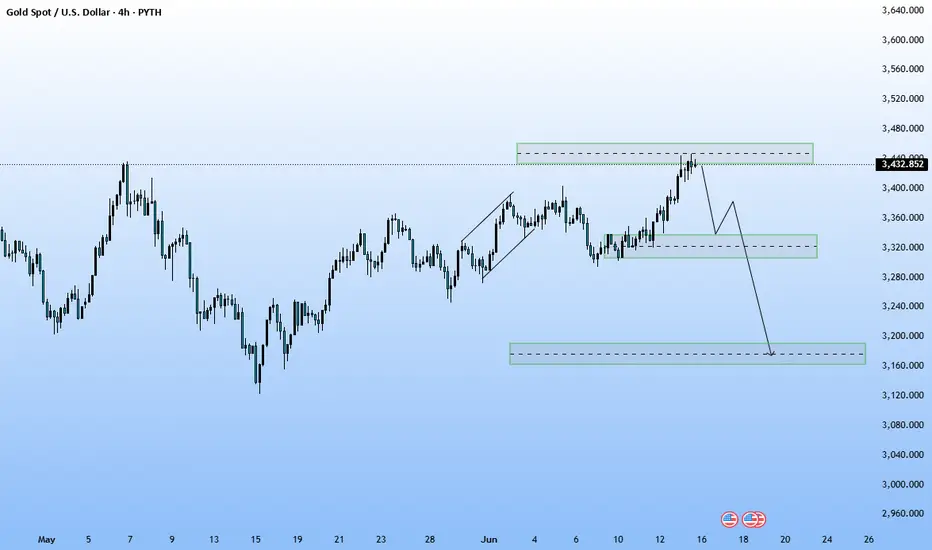
Current price: Gold is at approximately $3,432.85.
Recent price action: An upward movement is visible, forming higher highs and higher lows.
Resistance zone: The upper green box (around $3,460) signals a resistance area where the price might reverse.
Support zone: The lower green box (around $3,320) serves as a potential area for a pullback or bouncing upward.
Predicted movement: An arrow shows a projected drop from resistance down toward a lower support zone, near $3,160.
Overall view: The technical view suggests a reversal might happen after touching resistance, following a decline toward the lower support.
Disclaimer
The information and publications are not meant to be, and do not constitute, financial, investment, trading, or other types of advice or recommendations supplied or endorsed by TradingView. Read more in the Terms of Use.
Disclaimer
The information and publications are not meant to be, and do not constitute, financial, investment, trading, or other types of advice or recommendations supplied or endorsed by TradingView. Read more in the Terms of Use.