Thanks for sharing the image. It looks like a trading chart analysis (likely from TradingView), and it appears to be for XAUUSD (Gold vs. US Dollar). Here's a breakdown of what can be seen:
Key Observations:
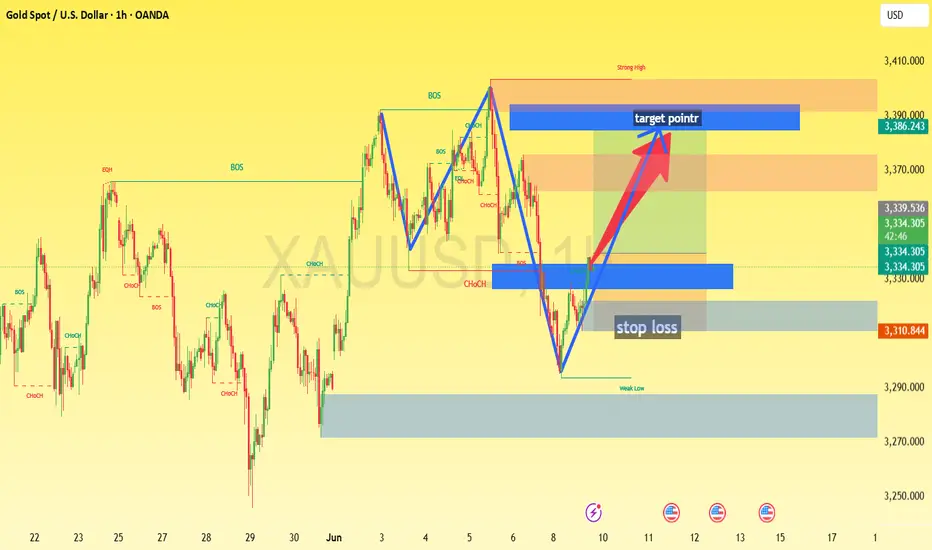
1. Chart Orientation & Tool:
The image is sideways; rotating it clockwise 90° would make it easier to view.
Platform: TradingView.
2. Instrument & Timeframe:
Symbol: XAUUSD.
Timeframe: 1H (1 Hour).
3. Chart Features:
A bearish harmonic pattern or potential M-formation is drawn.
Red downward arrow indicating a sell/short idea.
Target Point marked in blue around the 2295.000 area.
Stop Loss (SL) appears set near the 2340.000 level.
Several support/resistance levels/zones are highlighted with horizontal color bands (green, red, blue, yellow).
drop your like & comment
Key Observations:
1. Chart Orientation & Tool:
The image is sideways; rotating it clockwise 90° would make it easier to view.
Platform: TradingView.
2. Instrument & Timeframe:
Symbol: XAUUSD.
Timeframe: 1H (1 Hour).
3. Chart Features:
A bearish harmonic pattern or potential M-formation is drawn.
Red downward arrow indicating a sell/short idea.
Target Point marked in blue around the 2295.000 area.
Stop Loss (SL) appears set near the 2340.000 level.
Several support/resistance levels/zones are highlighted with horizontal color bands (green, red, blue, yellow).
drop your like & comment
Trade closed: stop reached
Target closed at 3375 near the last target JOIN MY TELEGRAM:
FREE SIGNALS TECHNICAL CHART AND EDUCATOIN
t.me/+j_sv6p9sL5I0MDY0
FREE SIGNALS TECHNICAL CHART AND EDUCATOIN
t.me/+j_sv6p9sL5I0MDY0
Disclaimer
The information and publications are not meant to be, and do not constitute, financial, investment, trading, or other types of advice or recommendations supplied or endorsed by TradingView. Read more in the Terms of Use.
JOIN MY TELEGRAM:
FREE SIGNALS TECHNICAL CHART AND EDUCATOIN
t.me/+j_sv6p9sL5I0MDY0
FREE SIGNALS TECHNICAL CHART AND EDUCATOIN
t.me/+j_sv6p9sL5I0MDY0
Disclaimer
The information and publications are not meant to be, and do not constitute, financial, investment, trading, or other types of advice or recommendations supplied or endorsed by TradingView. Read more in the Terms of Use.