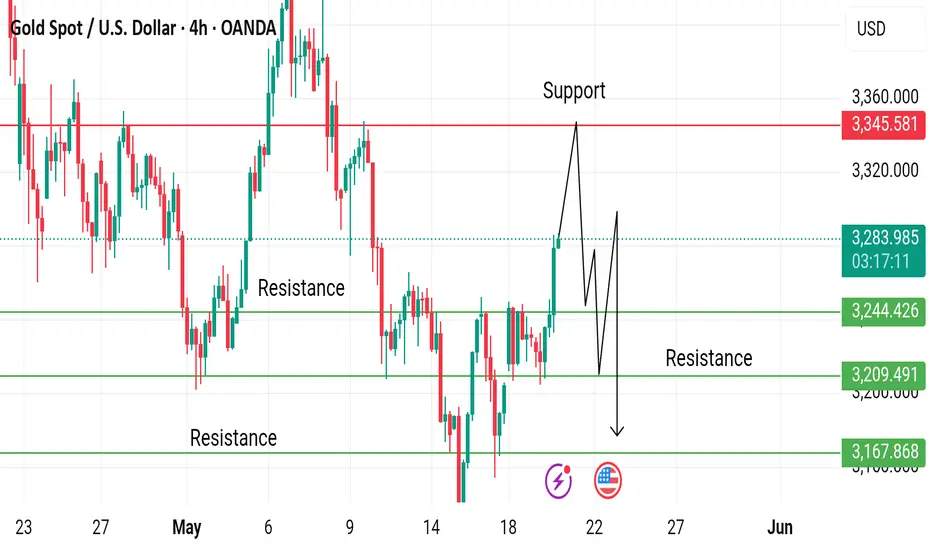
From a technical point of view, the daily chart for the XAU/USD pair shows it reached resistance at around a mildly bearish 20 Simple Moving Average (SMA) currently at $3,287.80, while the 100 and 200 SMAs maintain their firmly bullish slopes far below the current level. Technical indicators, in the meantime, gain upward traction but remain around their midlines. The bright metal would need to extend its rally beyond the $3,300 threshold to confirm a sustained leg higher.
Disclaimer
The information and publications are not meant to be, and do not constitute, financial, investment, trading, or other types of advice or recommendations supplied or endorsed by TradingView. Read more in the Terms of Use.
Disclaimer
The information and publications are not meant to be, and do not constitute, financial, investment, trading, or other types of advice or recommendations supplied or endorsed by TradingView. Read more in the Terms of Use.
