### **Gold (XAU/USD) Price Action Analysis – March 20, 2025**
#### **1. Overall Trend:**
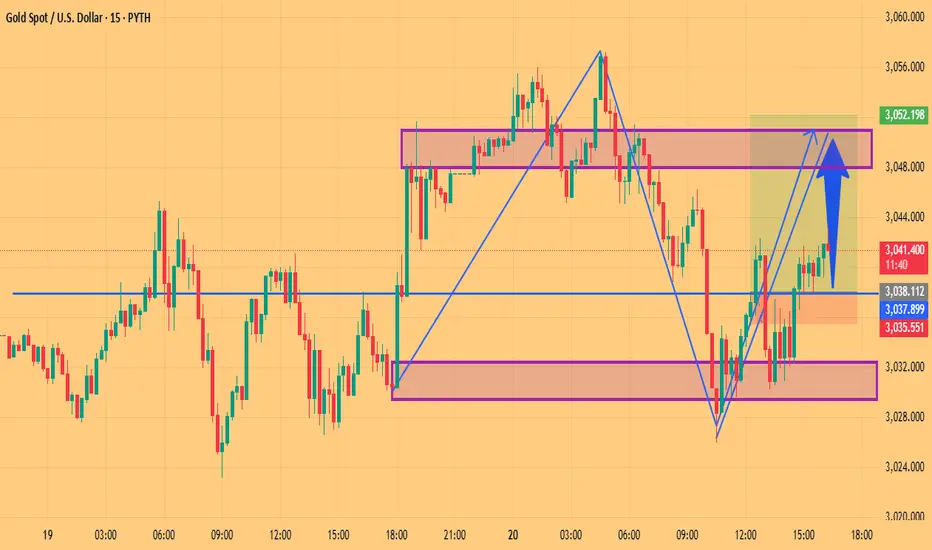
- The chart represents a **15-minute timeframe** of Gold (XAU/USD).
- The price recently formed a **sharp move up**, followed by a **retracement**.
- There is a clear **zig-zag pattern**, indicating a recent **high-volatility** phase.
#### **2. Key Levels:**
- **Resistance Zone (~3,048 - 3,052):** Marked by a purple box, this area has acted as a **previous supply zone** where price reversed.
- **Support Zone (~3,032 - 3,036):** Another purple box highlights a **demand area** where buyers stepped in.
- **Intermediate Level (~3,038):** A blue horizontal line indicates a smaller **support/resistance flip zone**.
#### **3. Technical Patterns & Possible Moves:**
- A **double-bottom** or **bullish reversal pattern** is forming near the **support zone (~3,032-3,035)**.
- The price is currently **moving up with higher lows**, which suggests **bullish momentum**.
- **Projected Move:** The blue arrow suggests an anticipated move **toward the 3,048 - 3,052 resistance zone**.
- **Confirmation:** If the price breaks above 3,052, it could lead to a **further rally**.
#### **4. Trading Considerations:**
- **Bullish Bias:** If price holds above 3,038 and forms a breakout, **long positions** targeting 3,048+ could be viable.
- **Bearish Risk:** Failure to break resistance at 3,048 may lead to a **retracement toward support (~3,035)**.
### **Conclusion:**
Gold is currently in a **short-term bullish recovery**, with resistance at **3,048 - 3,052** being the key level to watch. A breakout could push prices higher, while rejection might lead to another dip.
#### **1. Overall Trend:**
- The chart represents a **15-minute timeframe** of Gold (XAU/USD).
- The price recently formed a **sharp move up**, followed by a **retracement**.
- There is a clear **zig-zag pattern**, indicating a recent **high-volatility** phase.
#### **2. Key Levels:**
- **Resistance Zone (~3,048 - 3,052):** Marked by a purple box, this area has acted as a **previous supply zone** where price reversed.
- **Support Zone (~3,032 - 3,036):** Another purple box highlights a **demand area** where buyers stepped in.
- **Intermediate Level (~3,038):** A blue horizontal line indicates a smaller **support/resistance flip zone**.
#### **3. Technical Patterns & Possible Moves:**
- A **double-bottom** or **bullish reversal pattern** is forming near the **support zone (~3,032-3,035)**.
- The price is currently **moving up with higher lows**, which suggests **bullish momentum**.
- **Projected Move:** The blue arrow suggests an anticipated move **toward the 3,048 - 3,052 resistance zone**.
- **Confirmation:** If the price breaks above 3,052, it could lead to a **further rally**.
#### **4. Trading Considerations:**
- **Bullish Bias:** If price holds above 3,038 and forms a breakout, **long positions** targeting 3,048+ could be viable.
- **Bearish Risk:** Failure to break resistance at 3,048 may lead to a **retracement toward support (~3,035)**.
### **Conclusion:**
Gold is currently in a **short-term bullish recovery**, with resistance at **3,048 - 3,052** being the key level to watch. A breakout could push prices higher, while rejection might lead to another dip.
Trade active
xauusd gold signal start target 3038 to long 3041 target reach Note
booom booom 100 pips target reachedJoin my telegram channel free
t.me/usa_uae_xauusd_trader
Join my referal broker link
one.exnesstrack.org/a/mcl4ue398y?source=app
t.me/usa_uae_xauusd_trader
Join my referal broker link
one.exnesstrack.org/a/mcl4ue398y?source=app
Disclaimer
The information and publications are not meant to be, and do not constitute, financial, investment, trading, or other types of advice or recommendations supplied or endorsed by TradingView. Read more in the Terms of Use.
Join my telegram channel free
t.me/usa_uae_xauusd_trader
Join my referal broker link
one.exnesstrack.org/a/mcl4ue398y?source=app
t.me/usa_uae_xauusd_trader
Join my referal broker link
one.exnesstrack.org/a/mcl4ue398y?source=app
Disclaimer
The information and publications are not meant to be, and do not constitute, financial, investment, trading, or other types of advice or recommendations supplied or endorsed by TradingView. Read more in the Terms of Use.