Gold (XAU/USD) 4‑Hour Analysis: Tactical Setups and Key Levels
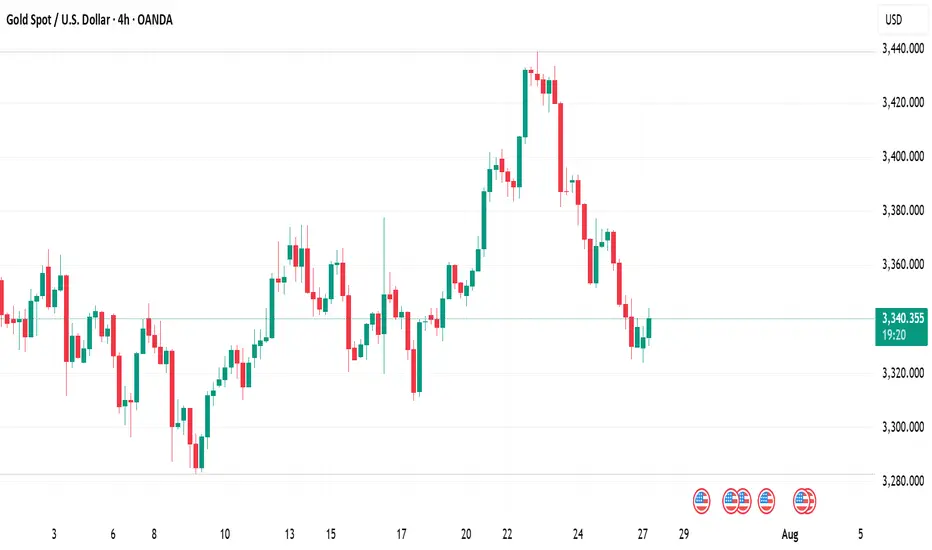
Gold (XAU/USD) is currently trading around $3,341.585, locked within a well‑defined range as market participants await fresh catalysts. The broader context suggests that the metal’s upside momentum has faded following weeks of consolidation, with price action now respecting technical levels more rigidly.
Market Structure and Price Behavior
On the 4‑hour chart, gold has been tracing out a descending channel or contracting triangle, reflecting indecision and the gradual absorption of liquidity at key levels. The price recently broke down from the upper boundary of this structure and is now retesting the breakdown zone—a classic pattern that often signals a continuation lower.
Support and Resistance Clusters
The most notable resistance lies between $3,344 and $3,350, an area defined by the broken channel top, recent swing highs, and an institutional supply zone. This area has repeatedly rejected upward price attempts, forming a natural sell‑on‑strength zone.
On the downside, the first support cluster lies between $3,333 and $3,344, where prior 4‑hour swing lows and minor order‑block demand converge. A deeper support band is located between $3,308 and $3,283, a historical base that coincides with multiple Fibonacci extensions and previously unfilled demand imbalances.
Indicators and Momentum Tools
Technical indicators reinforce the cautious outlook. The RSI is hovering in neutral territory, neither oversold nor overbought, while the MACD remains in negative momentum territory. The ADX suggests moderate trend strength, implying the potential for follow‑through if the retest of resistance is rejected. Collectively, these indicators highlight fading bullish pressure and a possible tilt toward renewed selling.
Smart‑Money Concepts
Institutional flow models suggest that liquidity resting above the $3,344–3,350 area may be targeted first before a more aggressive move lower. This aligns with order‑block theory and the expectation of liquidity sweeps at obvious stop‑loss zones. The likely progression would see price testing this resistance area, flushing out weak shorts, and then resuming its downward trajectory into the demand zones below.
The Golden Setup
Given the confluence of technical factors, the highest‑probability trade remains a short‑bias setup from the $3,344–3,350 resistance zone.
Direction: Short
Entry Level: $3,346 (within resistance zone)
Stop Loss: $3,351 (above the zone to protect against liquidity grabs)
Take Profit: $3,333 (initial target) with an extended target at $3,308 for those seeking a larger move
Confidence: High‑conviction
This setup capitalizes on the pattern of failed breakouts at the resistance cluster and offers a strong reward‑to‑risk profile. A clear 4‑hour close above $3,351 would invalidate the trade and signal that bulls are regaining control, potentially opening the path toward the next resistance region around $3,370–3,380.
Summary and Risk Considerations
Gold is at a pivotal juncture on the 4‑hour chart. The price action around the $3,344–3,350 zone will likely determine the next directional leg. Unless this area is broken convincingly, the technical structure favors a drift lower into the first support at $3,333 and possibly into the deeper accumulation area between $3,308 and $3,283.
Traders should remain disciplined, as a breakout above resistance would force a reassessment. Until that happens, the sell‑on‑strength strategy remains justified, with the Golden Setup providing a tactical entry aligned with both the broader technical picture and institutional order‑flow dynamics.
Key Levels at a Glance
Buy Zones: $3,333–3,344; deeper $3,308–3,283
Sell Zone: $3,344–3,350
Golden Setup: Short from $3,346, stop $3,351, take profit $3,333 → $3,308
This structure‑driven approach balances technical clarity with precise execution, providing a framework to navigate the current gold market with high confidence.
Disclaimer
The information and publications are not meant to be, and do not constitute, financial, investment, trading, or other types of advice or recommendations supplied or endorsed by TradingView. Read more in the Terms of Use.
Disclaimer
The information and publications are not meant to be, and do not constitute, financial, investment, trading, or other types of advice or recommendations supplied or endorsed by TradingView. Read more in the Terms of Use.