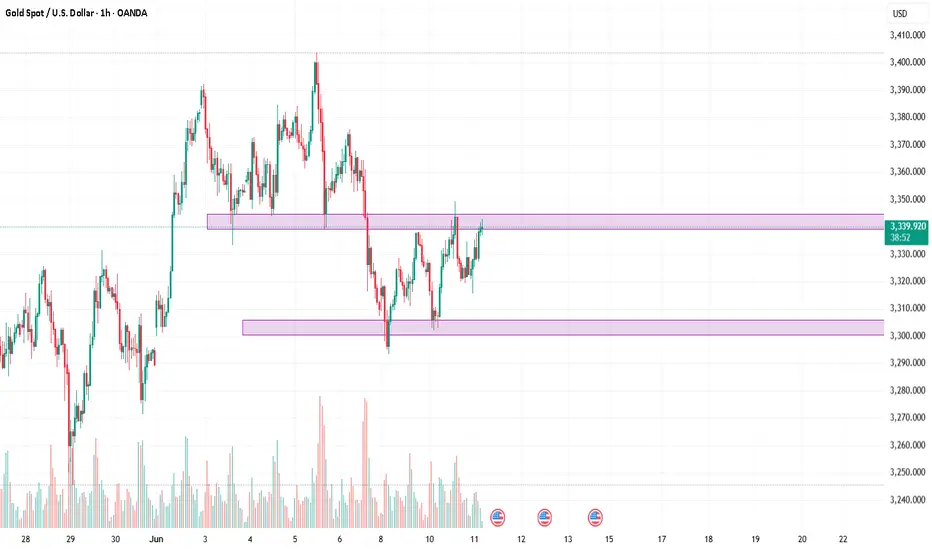
Current Price: Around $3,340 per ounce
Daily Range: ~$3,302 to ~$3,349
Key Drivers:
Ongoing U.S.–China trade talks in London creating near-term uncertainty
Technical resistance near EMA 50 (~$3,338–$3,342)
🔍 Comprehensive Technical Breakdown
Supply & Demand Zones
Resistance: $3,338–$3,350 (EMA 50 alignments)
Support: $3,310–$3,303 (ML, intraday pivot support) and deeper demand at $3,280–$3,262
Moving Averages
Price is currently below EMA 50 (≈$3,338) and below SMA/EMA 20/100/200, reflecting soft momentum
Oscillators
RSI ~46: neutral‑leaning bearish.
MACD positive but flattening.
Stochastics and Williams %R neutral–mixed
Price Action & Candles
Recent price attempts to break above EMA50 were rejected
Suggests short-term bearish pressure, but still within an overall bullish daily trend .
🎯 Four Intraday Trading Setups
1. Bullish Breakout ↗
Entry: 1‑hr candle close above $3,342–$3,345 (break above EMA50 + supply zone).
Stop Loss: ~$3,336 (below breakout candle).
Take Profits: TP1 = $3,360 (next supply), TP2 = $3,380.
Confluences:
Break of EMA50 (50-EMA rejects) + volume momentum.
MACD building above zero and RSI rising.
Trigger: Momentum candle with volume, confirmed close above entry zone.
2. Bearish Rejection ↘
Entry: Short if gold tests $3,342–$3,345 and forms a reversal candle (bearish engulfing, pin bar).
Stop Loss: $3,352 (just above high).
Take Profits: TP1 = $3,322, TP2 = $3,310 (Fibonacci and demand flip).
Confluences:
Resistance at EMA50/supply zone + oscillator failure (RSI flattening).
Candlestick rejection pattern.
Trigger: Clear bearish reversal candle off resistance.
3. Bearish Breakdown ↘
Entry: On break and 1‑hr close below $3,303 (mid‑intraday support).
Stop Loss: $3,310 (above breakdown level).
Take Profits: TP1 = $3,280, TP2 = $3,262 (deeper demand zone)
Confluences:
Support zone break, momentum confirmation, bearish MACD crossover.
Elliott wave confirms downward corrective extension.
Trigger: Hourly close below support followed by follow-through.
4. Bullish Bounce ↗
Entry: On a strong bullish candle near $3,303–$3,310 support zone.
Stop Loss: $3,298 (below support).
Take Profits: TP1 = $3,326 (mid-range), TP2 = $3,342 (EMA50).
Confluences:
Demand zone bounce, oversold indications (stochastic bounce), trendline support.
Lower timeframe pattern (double bottom, morning star).
Trigger: Bullish rejection candle with size and strength.
⚠️ Risk & Market Notes
Volatility essentials: Events like US CPI and trade-talk updates may trigger sharp moves.
Trade confirmation: Stick to your trigger rules; intraday moves can be whipsawing.
Risk management: Use appropriate position sizes and consider potential slippage.
Disclaimer
The information and publications are not meant to be, and do not constitute, financial, investment, trading, or other types of advice or recommendations supplied or endorsed by TradingView. Read more in the Terms of Use.
Disclaimer
The information and publications are not meant to be, and do not constitute, financial, investment, trading, or other types of advice or recommendations supplied or endorsed by TradingView. Read more in the Terms of Use.