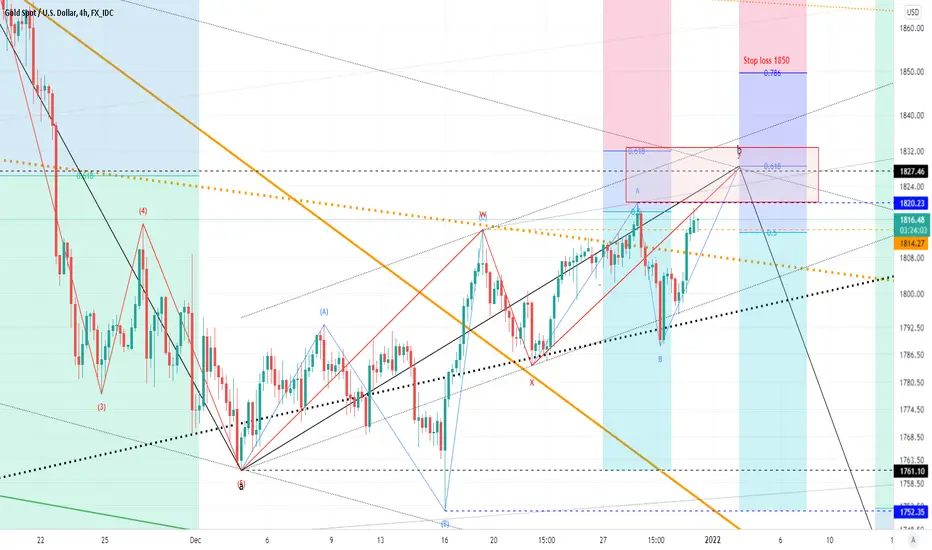
■Outlook of XAUUSD on 4h chart.
Waves on the upper degree are probably "Bottom flat descending Triangle".
We are on wave E of the Triangle. and, Sub-waves of wave E are "Zigzag".
The Sub-wave a of Zigzag is 5 waves Impulse.
I think that the Sub-wave b of Zigzag is 3 waves Double three(W,X,Y).
Wave w was "Expanded Flat".and, Wave x was "Zigzag"
I think that wave Y will be "Regular Flat"
The sub-wave b retraced Fibo 50% of sub-wave a.
The sub-wave b will finish soon.
Probably, The last "wave c" will be 5 waves impulse.
The lengths of "sub-wave a" and "sub-wave c" will be the same.
If the assumptions are correct, I think the wave E target will be in the range of wave D's Fibonacci 78.6% to 90.0% or supported by an extension line connecting the end of sub-wave A and C.
Probably, The wave E (Orange) will grow to the levels of 1700-1720.
In this scenario, the stop loss level is 1850.
■Last time my idea, Nov 21

■Dec 17 idea;

Waves on the upper degree are probably "Bottom flat descending Triangle".
We are on wave E of the Triangle. and, Sub-waves of wave E are "Zigzag".
The Sub-wave a of Zigzag is 5 waves Impulse.
I think that the Sub-wave b of Zigzag is 3 waves Double three(W,X,Y).
Wave w was "Expanded Flat".and, Wave x was "Zigzag"
I think that wave Y will be "Regular Flat"
The sub-wave b retraced Fibo 50% of sub-wave a.
The sub-wave b will finish soon.
Probably, The last "wave c" will be 5 waves impulse.
The lengths of "sub-wave a" and "sub-wave c" will be the same.
If the assumptions are correct, I think the wave E target will be in the range of wave D's Fibonacci 78.6% to 90.0% or supported by an extension line connecting the end of sub-wave A and C.
Probably, The wave E (Orange) will grow to the levels of 1700-1720.
In this scenario, the stop loss level is 1850.
■Last time my idea, Nov 21
■Dec 17 idea;
Disclaimer
The information and publications are not meant to be, and do not constitute, financial, investment, trading, or other types of advice or recommendations supplied or endorsed by TradingView. Read more in the Terms of Use.
Disclaimer
The information and publications are not meant to be, and do not constitute, financial, investment, trading, or other types of advice or recommendations supplied or endorsed by TradingView. Read more in the Terms of Use.