Trades has differences approaches in order to interpret price.
Some traders will see weddes, pennants, channels including support resistance and dynamic lines, others harmonics and waves trents etc.
Chart are like songs, u can remix a song into R&B hiphop house Techno ( The Hek Am Talking About)
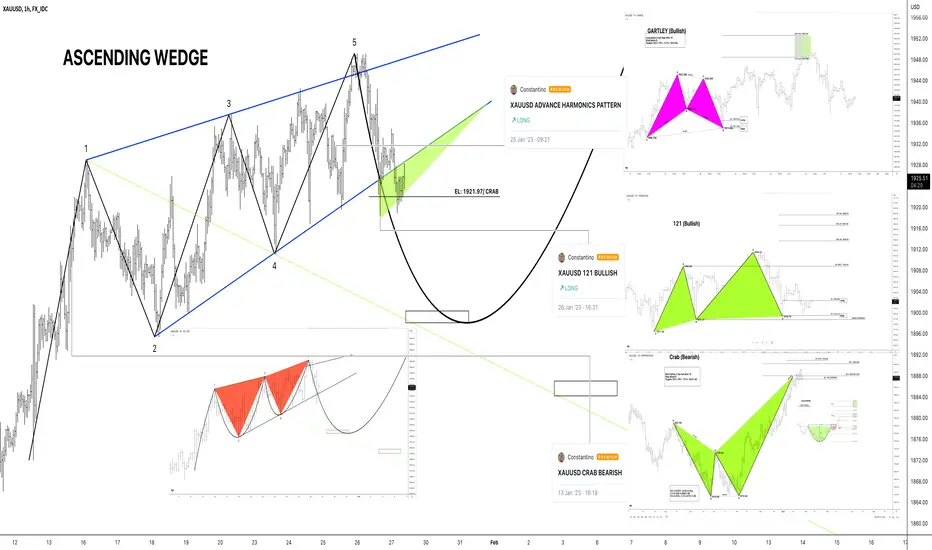
XAUUSD we can see the price has formed an Ascending Wedge,
and price has broken the floor of the ascending wedge.
Again if i have to interpret this chart beginning with basics:
1 Ascending Wedge-Chart Pattern
2 3 Drives Bearish-Harmonics
3 wolfe Waves Pattern-Waves trent Alyst
XAUUSD also trading a Cup And Handle Pattern on its Daily Chart and the price has reached the main targets on the way forming other harmionic Pattern Crab on its daily.
Looks and seems to me Gold Deserves A Pullback at some point and defitnetly i wont over look at this chart.
IF I Were thinking in a bearish outcome the 1921.97 could be a great level to look at.
Not giving a call here. just a chart to take in consideration
I Am interpreting price or at least trying too.
Some traders will see weddes, pennants, channels including support resistance and dynamic lines, others harmonics and waves trents etc.
Chart are like songs, u can remix a song into R&B hiphop house Techno ( The Hek Am Talking About)
XAUUSD we can see the price has formed an Ascending Wedge,
and price has broken the floor of the ascending wedge.
Again if i have to interpret this chart beginning with basics:
1 Ascending Wedge-Chart Pattern
2 3 Drives Bearish-Harmonics
3 wolfe Waves Pattern-Waves trent Alyst
XAUUSD also trading a Cup And Handle Pattern on its Daily Chart and the price has reached the main targets on the way forming other harmionic Pattern Crab on its daily.
Looks and seems to me Gold Deserves A Pullback at some point and defitnetly i wont over look at this chart.
IF I Were thinking in a bearish outcome the 1921.97 could be a great level to look at.
Not giving a call here. just a chart to take in consideration
I Am interpreting price or at least trying too.
Note
Note
Targets at 1901.83 i will update at some pointNote
Note
the Price is trading below the 1921 Note

Note
Note
wondering if gold is ready for the short;Disclaimer
The information and publications are not meant to be, and do not constitute, financial, investment, trading, or other types of advice or recommendations supplied or endorsed by TradingView. Read more in the Terms of Use.
Disclaimer
The information and publications are not meant to be, and do not constitute, financial, investment, trading, or other types of advice or recommendations supplied or endorsed by TradingView. Read more in the Terms of Use.