7.15 Gold Market Analysis
Driving Factor Analysis
1. Safe-haven demand: the bottoming force of policy risks and geopolitical games
Trade frictions escalate: Trump announced that tariffs will be imposed on the EU and Mexico from August 1. The EU has prepared a 21 billion euro counter-list, but the opening of the "negotiation window" has weakened the panic.
Geopolitical risks are rising: Trump issued a 50-day ultimatum to Russia, threatening to impose 100% tariffs on Russian goods and sanction its oil buyers. If the situation between Russia and Ukraine deteriorates, it may trigger a new round of safe-haven buying.
Capital flows confirm: the world's largest gold ETF (SPDR) ended its reduction and turned to a small increase in positions, showing the configuration needs of institutions to prevent "black swans".
2. US dollar and interest rates: "double shackles" that suppress gold prices
The strong crushing of the US dollar: the US dollar index stood firm at the 98 mark to hit a three-month high, pushing up the gold purchase cost of non-US currency holders and directly suppressing international buying.
U.S. Treasury yields climbed: 30-year Treasury yields approached 5% (five-week high), and 10-year yields hit 4.447% (four-week high), increasing the opportunity cost of holding interest-free gold.
Fed policy deadlock: The White House's pressure to cut interest rates (Trump called for interest rates to fall below 1%) and the Fed's resistance to easing are in opposition, and policy confusion amplifies gold price fluctuations.
3. Long-term support factors
Despite short-term pressure, the central bank's gold purchases (global de-dollarization trend) and Asian physical demand (wedding and investment combined) still provide resilient support for gold prices.
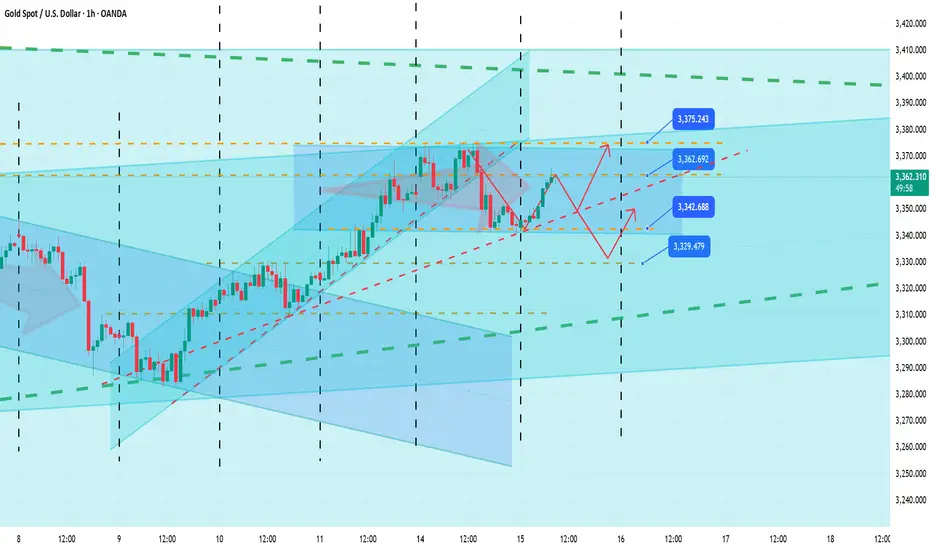
Technical structure and key points
Resistance area: 3370-3375 US dollars constitute a strong resistance zone, where the previous highs converge with the upper track of the daily Bollinger band, and multiple unsuccessful attacks confirm the effectiveness of the pressure.
Support area:
Short-term: 3340-3345 US dollars (yesterday's low coincides with the H4 cycle 50 moving average), if broken, it may trigger technical selling.
Mid-term: 3322-3338 USD (55-day and 21-day moving averages are densely packed). If it fails, it may drop to 3300 USD.
Technical indicator signal: MACD maintains golden cross but the red column shortens, and RSI falls back to around 55, indicating that the bullish momentum is weakening and needs to accumulate strength. The risk of a pullback before breaking through the previous high is greater than the probability of continued rise.
Operation strategy suggestions
1. Short order opportunity
Aggressive strategy: Rebound to 3355-3360 USD with a light position to try shorting, stop loss set above 3365 USD, and target down to 3340 USD (break can be chased to 3330).
Conservative strategy: If it touches the strong resistance area of 3380-3385 USD and is blocked, add positions to short, stop loss at 3390 USD, and target 3350 USD.
2. Long position opportunity
After falling back to the support area of 3330-3335 USD and stabilizing, go long with a light position, stop loss at 3325 USD, and target at 3345-3350 USD.
If it breaks down strongly below 3340 USD, you can go short to 3310-3300 USD.
3. Risk control focus
Single position ≤ 2% of total funds, use pending orders (such as 3358 break short orders) to deal with the risk of false break.
Focus on today's US June CPI data: If the core CPI annual rate exceeds expectations by 3% (previous value 2.8%), it will strengthen the expectation of interest rate hikes and bearish gold; if it is lower than expected, it may activate interest rate cut bets to promote a rebound.
If my analysis can help you, I hope you can cheer me up and give me a thumbs up.
Driving Factor Analysis
1. Safe-haven demand: the bottoming force of policy risks and geopolitical games
Trade frictions escalate: Trump announced that tariffs will be imposed on the EU and Mexico from August 1. The EU has prepared a 21 billion euro counter-list, but the opening of the "negotiation window" has weakened the panic.
Geopolitical risks are rising: Trump issued a 50-day ultimatum to Russia, threatening to impose 100% tariffs on Russian goods and sanction its oil buyers. If the situation between Russia and Ukraine deteriorates, it may trigger a new round of safe-haven buying.
Capital flows confirm: the world's largest gold ETF (SPDR) ended its reduction and turned to a small increase in positions, showing the configuration needs of institutions to prevent "black swans".
2. US dollar and interest rates: "double shackles" that suppress gold prices
The strong crushing of the US dollar: the US dollar index stood firm at the 98 mark to hit a three-month high, pushing up the gold purchase cost of non-US currency holders and directly suppressing international buying.
U.S. Treasury yields climbed: 30-year Treasury yields approached 5% (five-week high), and 10-year yields hit 4.447% (four-week high), increasing the opportunity cost of holding interest-free gold.
Fed policy deadlock: The White House's pressure to cut interest rates (Trump called for interest rates to fall below 1%) and the Fed's resistance to easing are in opposition, and policy confusion amplifies gold price fluctuations.
3. Long-term support factors
Despite short-term pressure, the central bank's gold purchases (global de-dollarization trend) and Asian physical demand (wedding and investment combined) still provide resilient support for gold prices.
Technical structure and key points
Resistance area: 3370-3375 US dollars constitute a strong resistance zone, where the previous highs converge with the upper track of the daily Bollinger band, and multiple unsuccessful attacks confirm the effectiveness of the pressure.
Support area:
Short-term: 3340-3345 US dollars (yesterday's low coincides with the H4 cycle 50 moving average), if broken, it may trigger technical selling.
Mid-term: 3322-3338 USD (55-day and 21-day moving averages are densely packed). If it fails, it may drop to 3300 USD.
Technical indicator signal: MACD maintains golden cross but the red column shortens, and RSI falls back to around 55, indicating that the bullish momentum is weakening and needs to accumulate strength. The risk of a pullback before breaking through the previous high is greater than the probability of continued rise.
Operation strategy suggestions
1. Short order opportunity
Aggressive strategy: Rebound to 3355-3360 USD with a light position to try shorting, stop loss set above 3365 USD, and target down to 3340 USD (break can be chased to 3330).
Conservative strategy: If it touches the strong resistance area of 3380-3385 USD and is blocked, add positions to short, stop loss at 3390 USD, and target 3350 USD.
2. Long position opportunity
After falling back to the support area of 3330-3335 USD and stabilizing, go long with a light position, stop loss at 3325 USD, and target at 3345-3350 USD.
If it breaks down strongly below 3340 USD, you can go short to 3310-3300 USD.
3. Risk control focus
Single position ≤ 2% of total funds, use pending orders (such as 3358 break short orders) to deal with the risk of false break.
Focus on today's US June CPI data: If the core CPI annual rate exceeds expectations by 3% (previous value 2.8%), it will strengthen the expectation of interest rate hikes and bearish gold; if it is lower than expected, it may activate interest rate cut bets to promote a rebound.
If my analysis can help you, I hope you can cheer me up and give me a thumbs up.
❤️I am a trading researcher focusing on the gold field.
❤️If you are looking for direction, welcome to follow me.
👉t.me/+CW0VWaiEB59hMmJh
❤️If you are looking for direction, welcome to follow me.
👉t.me/+CW0VWaiEB59hMmJh
Disclaimer
The information and publications are not meant to be, and do not constitute, financial, investment, trading, or other types of advice or recommendations supplied or endorsed by TradingView. Read more in the Terms of Use.