I. Gold's Current Core Contradiction
Bull Support Factors
Weak non-farm payroll data reinforces expectations of a Fed rate cut, with the market betting on an over 80% probability of a September rate cut.
Risk Aversion: Although the tariff extension has not yet been finalized, the market remains concerned about escalating trade frictions, and gold is in high demand as a safe-haven asset.
Technical Breakout: Friday saw a strong breakout above the 3340-3350 resistance zone, with the daily chart showing a positive enveloping negative trend. Short-term bullish momentum prevails.
Potential Short-Term Opportunities
Monthly Top Signal: Consecutive high-level doji candlesticks with long upper shadows suggest medium-term selling pressure.
Fundamental Bearish Hidden Dangers:
The Fed's independence remains, and Powell may not cut interest rates prematurely due to pressure from Trump.
II. Key Technical Signals
1. Weekly Level: Range Unbroken
The 3268-3438 range persists, currently nearing its upper limit, so be wary of a pullback.
Bollinger Bands are converging, with the MA5/MA10 convergence signaling an approaching market reversal window.
2. Daily and short-term cycles: Overbought correction needs
After Friday's surge: 4-hour/1-hour RSI is overbought, the Bollinger Band opening is unsustainable, and a technical retracement is needed.
Key positions:
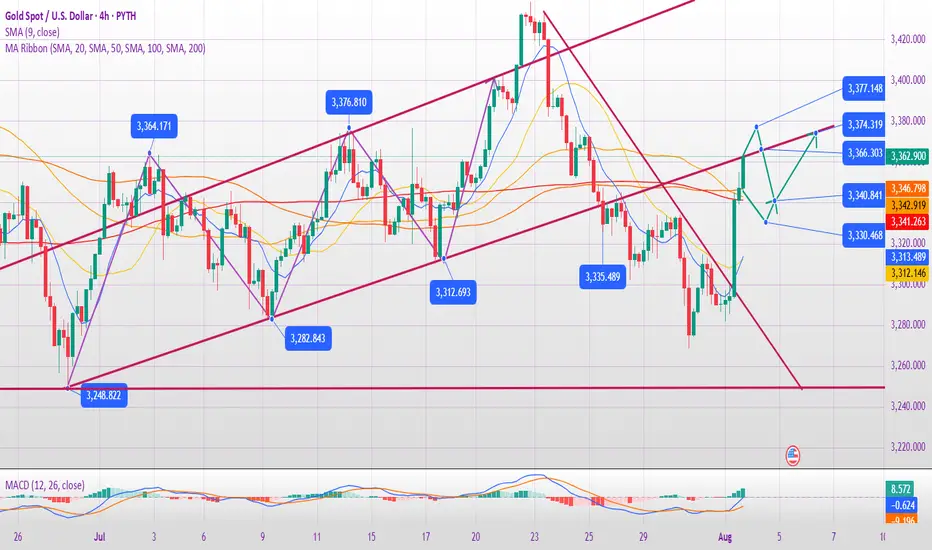
Resistance: 3376 (previous high) + 3385 (Fibonacci expansion level);
Support: 3340 (top and bottom conversion) + 3315 (bull defense line).
3. Triangle convergence pattern:
If it opens high and breaks through 3376 on Monday, August 4, it may test 3400; if it opens low and falls below 3340, it will look down to 3315-3280.
III. Operation strategy for next week on August 4
(1) Response to three opening scenarios
Scenario 1: Opening high (above 3370)
Strategy: Short in batches in the 3376-3385 area, stop loss at 3400, target 3340→3315.
Logic: Positive overdraft + technical overbought, betting on a pullback.
Scenario 2: Flat opening (around 3360)
Strategy: If the price rises from 3366 but does not break through, go short with a light position, stop loss at 3376, target 3340; if it falls below 3340, go short and look at 3315.
Alternative: If the support at 3340 is effective, go long, stop loss at 3330, target 3360.
Scenario 3: Low opening (below 3340)
Strategy: Go long in the 3338-3340 area, stop loss at 3325, target 3360; if it breaks through 3315, go short.
(2) Mid-term layout
Short opportunity: Go short in the 3385-3400 area, stop loss at 3420, target 3245 (monthly support).
Buy opportunity: If the price falls back to 3315-3280 at the beginning of the week and stabilizes, go long in the mid-term, stop loss at 3260, target 3400.
IV. Risks and Warnings
Beware of institutional manipulation: Friday's late-day surge may be a trap for buying; beware of a flash crash at Monday's opening.
Data disturbance: Pay close attention to the speeches of Fed officials. If inflation rebounds or hawkish remarks are made, it will be bearish for gold.
Undetermined trend: The market is still volatile and unilateral trends need to wait for confirmation of a breakthrough in the range.
Conclusion
Short-term: Prioritize shorting in the 3370-3385 area, and enter long positions in the 3340-3315 area when appropriate, maintaining strict stop-loss orders.
Mid-term: The monthly bearish pattern has not changed, and above 3385 is the ideal entry point for short positions.
Key Strategies: "Don't chase long positions during strong resistance; don't sell short during deep declines; follow the trend after a breakout; exercise caution in controlling the market."
Trade active
August 4, 2025 Gold Trading Analysis Report:
I. [Fundamental News Analysis]
▶ Market Drivers:
Weak US Non-Farm Payroll Data
The non-farm payroll data released last Friday was far below expectations, showing signs of an economic slowdown.
This directly boosted market expectations for a September Fed rate cut, with the probability of a cut soaring from 38% to 90%.
Changes in Fed Policy Expectations
The market anticipates two rate cuts this year, with the first possibly in September.
Rate cuts are positive for gold, a non-interest-bearing asset.
Risk Aversion Rising
The Trump administration's announcement of new tariffs has triggered increased demand for safe-haven assets.
Weaker US Dollar
The weakening US dollar index is supporting further gains in gold prices.
📌 Fundamental Conclusion: Weak economic data, dovish policy expectations, and risk aversion are the three main factors supporting gold's rally.
II. [Technical Trend Analysis]
▶ Daily Chart Analysis:
Gold has been in a wide range-bound trading range since mid-May.
Last Friday's daily close showed a large bullish candle, indicating strong bullish momentum.
Currently, the trend is range-bound and slightly stronger. The key question is whether it can break through the 3375 resistance level.
▶ 4-Hour Chart Analysis:
Gold has experienced a wave of consecutive gains and is currently fluctuating near the middle Bollinger Band.
Upward pressure at 3375 is a concern (a point of resistance seen multiple times); a break above would open up further upside potential.
Downward support at 3340-3335 is a confirmation zone for pullbacks from previous gains.
A break below 3335 would signal a return to a range-bound trading pattern, with support at 3300.
📌 Technical Conclusion: The market has not yet turned unilateral, but is biased towards a bullish trend. A break above 3375 is a key indicator of potential upside.
III. [Key Technical Levels]
Upward Resistance: 3375 is a key level dividing bulls and bears; a break above this level could usher in a new uptrend.
Upward Strong Resistance: 3390-3400 is a key level, representing previous highs and experiencing significant selling pressure.
Downward Support: 3340-3335 is a key defensive level; a break below this level could trigger a period of volatility.
Downward Strong Support: 3300 is a key level of support for major pullbacks.
IV. [Trading Strategy]
✅ Main Strategy: Buy on pullbacks, with shorting on rebounds as a supplement.
📈 Long Trade Recommendations:
Place long positions in batches upon a pullback to the 3355-3340 area.
Stop-loss: Set below 3332.
Target: Initially target 3375, then 3390-3400 upon a breakout.
📉 Short Trading Recommendations (Short-Term Hedging):
If gold prices encounter significant resistance in the 3390-3400 area, consider a light short position.
Stop-loss: Set above 3405.
Target: Look back to the 3370-3360 area.
V. [Trading Summary]
The current market is primarily driven by bullish factors, and the bullish trend is brewing a breakout.
Maintain a bullish strategy, with a defensive level set at 3335.
A successful break above 3375 will fully unleash bullish sentiment, potentially ushering in a new bull market.
❤️Free gold trading signals:t.me/+OJSbWQ6F4KM2Mzk1
💥Gold trading analyst | Technology + logic dual drive
💯Intraday/band strategy analysis | Risk control first, win in stability
💥Gold trading analyst | Technology + logic dual drive
💯Intraday/band strategy analysis | Risk control first, win in stability
Related publications
Disclaimer
The information and publications are not meant to be, and do not constitute, financial, investment, trading, or other types of advice or recommendations supplied or endorsed by TradingView. Read more in the Terms of Use.