Good evening traders
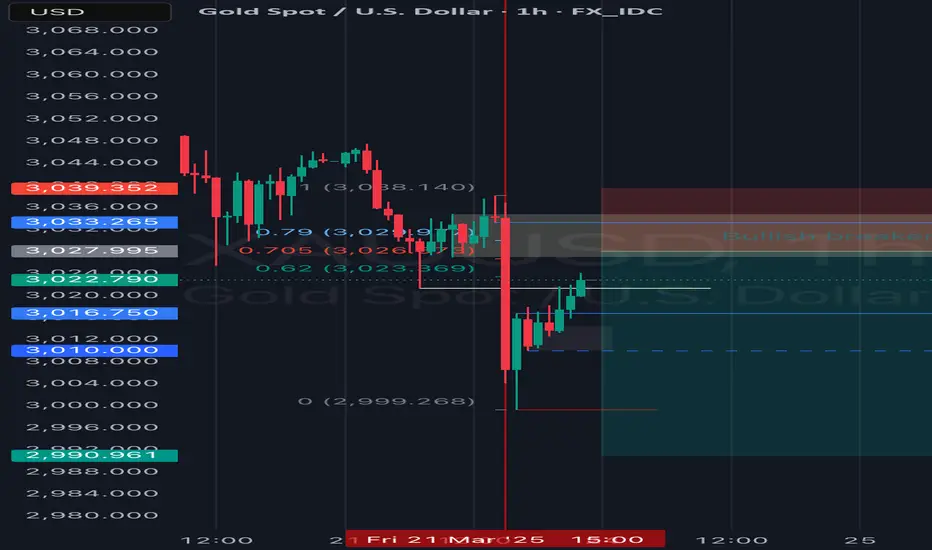
Here we have an hourly chart with some lines that I’ll try to explain, in this set up the ‘WHY’ is the bullish breaker we wanna see the market revisit and I have marked the breaker with a white rectangle and overlapping that rectangle we have two blue line which represents our SIBI/FVG and with this FVG we would really appreciate it if price doesn’t fill all of that gap.
The line plotted on the previous low that’s being broken highlights the shift in market structure lower on the 1 hour timeframe
Disclaimer
The information and publications are not meant to be, and do not constitute, financial, investment, trading, or other types of advice or recommendations supplied or endorsed by TradingView. Read more in the Terms of Use.
Disclaimer
The information and publications are not meant to be, and do not constitute, financial, investment, trading, or other types of advice or recommendations supplied or endorsed by TradingView. Read more in the Terms of Use.