Multi-Timeframe Analysis – Gold (XAU/USD)
⸻
1H Chart – Bullish Continuation Potential
On the 1-hour chart, Gold is trading within a defined channel structure after reaching an all-time high (ATH) of 3357.775. Following this peak, the price made a shallow retracement between the 38.2% and 50% Fibonacci levels, indicating underlying bullish strength.
Currently, the price has formed a Descending Broadening Wedge — a pattern typically associated with bullish continuation. A successful breakout above the wedge’s upper boundary and the key resistance levels at 3334, 3346, and 3357 could pave the way for a rally toward the 3400 level.
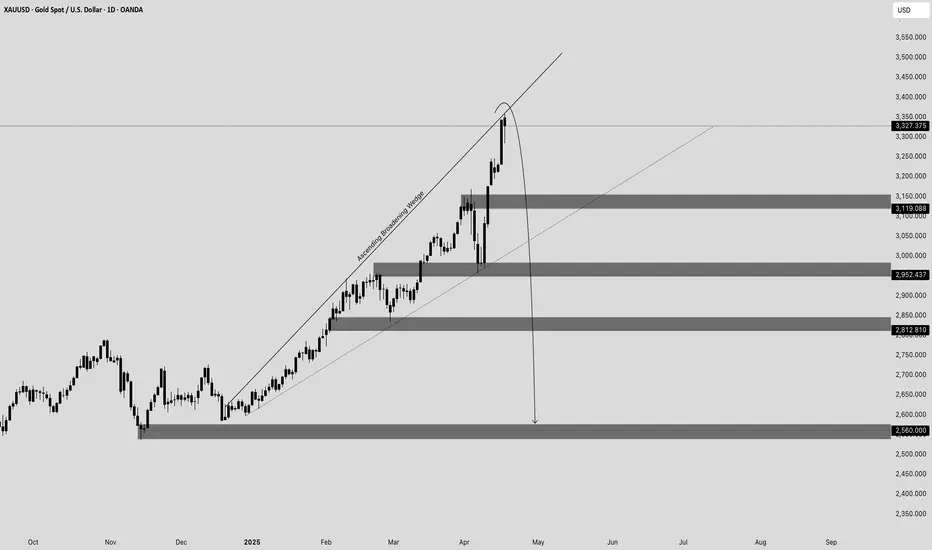
Daily Chart – Bearish Reversal Structure
In contrast, the daily chart reveals an Ascending Broadening Wedge — a known bearish reversal pattern. The price is trading near the upper region of this structure, and the measured move projection of the pattern points toward a potential decline to the 2560 area, should the bearish scenario play out.
⸻
Final Note
While short-term charts signal bullish opportunities, the daily chart reminds us of the broader reversal risks. As always, strict risk management is essential to protect capital and lock in profits in both trending and volatile conditions.
⸻
Happy Trading,
SpicyPips
Disclaimer
The information and publications are not meant to be, and do not constitute, financial, investment, trading, or other types of advice or recommendations supplied or endorsed by TradingView. Read more in the Terms of Use.
Disclaimer
The information and publications are not meant to be, and do not constitute, financial, investment, trading, or other types of advice or recommendations supplied or endorsed by TradingView. Read more in the Terms of Use.