Gold (XAUUSD) Technical Analysis
Date: May 21, 2025
Framework: Smart Money Concepts (SMC) / Inner Circle Trader (ICT)
---
Market Overview
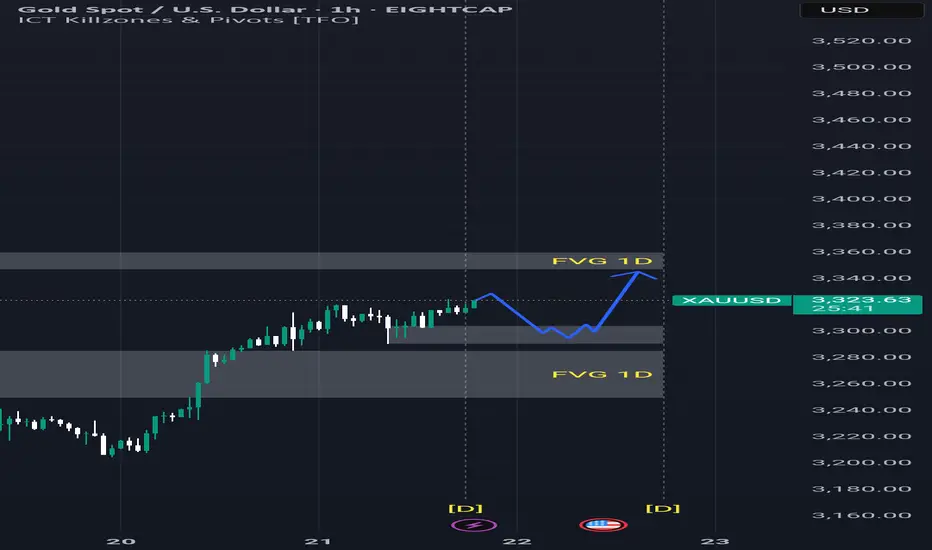
Gold (XAUUSD) on the 1-hour timeframe continues to maintain a bullish market structure, currently trading at $3,322.55 USD, following a strong upward move after breaking previous resistance.
---
Key Technical Factors
1. Fair Value Gaps (FVG):
Daily FVG below: $3,300 – $3,310
Daily FVG above: $3,350 – $3,360
2. Market Structure:
Continues forming Higher Highs and Higher Lows
No signs of Market Structure Break (MSB) or reversal
3. Liquidity Zones:
Liquidity likely resides below $3,310
This area aligns with an unfilled FVG and possible bullish Order Block (OB)
---
Intraday Outlook
Price is expected to retrace slightly toward the $3,300–$3,310 FVG to fill imbalance and grab liquidity.
Once that zone is tapped and demand is confirmed, price is likely to bounce upward toward the upper FVG at $3,350–$3,360.
Strategy favors a buy setup, waiting for bullish confirmation inside the lower FVG.
---
Suggested Trading Plan
Component Price Range (Approx.)
Buy Zone $3,300 – $3,310
Stop Loss (SL) Below $3,295
Take Profit (TP) $3,350 – $3,360
---
Risk Disclaimer
> This analysis is provided for educational and technical insight purposes only, based on the SMC/ICT methodology. It does not constitute financial advice or a recommendation to trade.
Trading in financial markets carries a high level of risk. You should do your own research and manage risk appropriately.
Past performance is not indicative of future results.
Date: May 21, 2025
Framework: Smart Money Concepts (SMC) / Inner Circle Trader (ICT)
---
Market Overview
Gold (XAUUSD) on the 1-hour timeframe continues to maintain a bullish market structure, currently trading at $3,322.55 USD, following a strong upward move after breaking previous resistance.
---
Key Technical Factors
1. Fair Value Gaps (FVG):
Daily FVG below: $3,300 – $3,310
Daily FVG above: $3,350 – $3,360
2. Market Structure:
Continues forming Higher Highs and Higher Lows
No signs of Market Structure Break (MSB) or reversal
3. Liquidity Zones:
Liquidity likely resides below $3,310
This area aligns with an unfilled FVG and possible bullish Order Block (OB)
---
Intraday Outlook
Price is expected to retrace slightly toward the $3,300–$3,310 FVG to fill imbalance and grab liquidity.
Once that zone is tapped and demand is confirmed, price is likely to bounce upward toward the upper FVG at $3,350–$3,360.
Strategy favors a buy setup, waiting for bullish confirmation inside the lower FVG.
---
Suggested Trading Plan
Component Price Range (Approx.)
Buy Zone $3,300 – $3,310
Stop Loss (SL) Below $3,295
Take Profit (TP) $3,350 – $3,360
---
Risk Disclaimer
> This analysis is provided for educational and technical insight purposes only, based on the SMC/ICT methodology. It does not constitute financial advice or a recommendation to trade.
Trading in financial markets carries a high level of risk. You should do your own research and manage risk appropriately.
Past performance is not indicative of future results.
Disclaimer
The information and publications are not meant to be, and do not constitute, financial, investment, trading, or other types of advice or recommendations supplied or endorsed by TradingView. Read more in the Terms of Use.
Disclaimer
The information and publications are not meant to be, and do not constitute, financial, investment, trading, or other types of advice or recommendations supplied or endorsed by TradingView. Read more in the Terms of Use.