🔹 Market Structure:
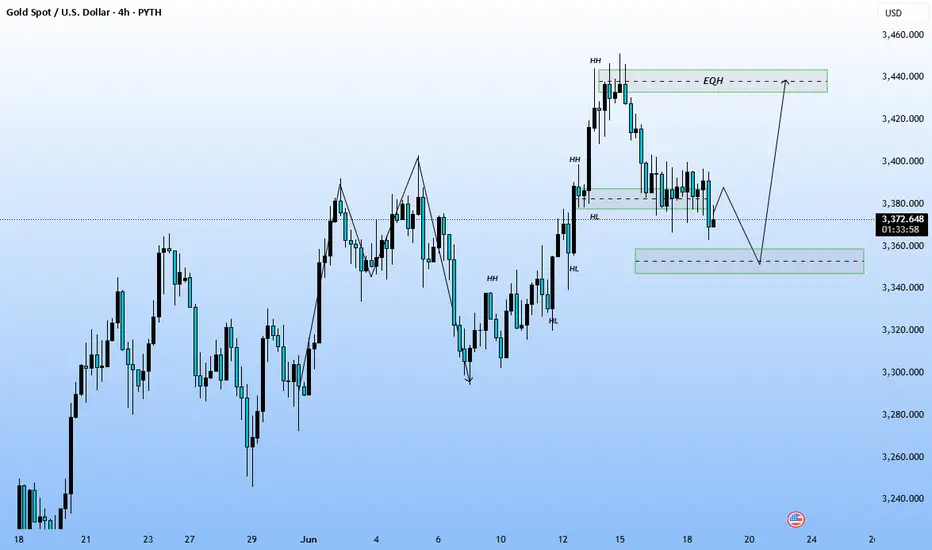
The chart shows a recent market high followed by a correction.
Current price: $3,373.849
Price is moving in a downtrend retracement after a bullish leg.
🔹 Key Levels Highlighted:
EQH (Equal Highs) around $3,440 zone marked as a liquidity target.
Demand zone (green box) around $3,355–$3,360, showing possible entry for long/buy.
Short-term support area aligned with FVG or OB (likely).
📈 Possible Scenario Illustrated:
Short-term Bearish Move:
Price might drop into the lower demand zone to mitigate imbalance or tap into demand.
Reversal Zone:
Upon reaching the lower green box (demand zone), a reversal is expected.
Bullish Target:
The chart anticipates a bullish rally aiming toward the EQH (equal highs) near $3,440, where liquidity may be resting.
🔍 Technical Tools Used:
Structure Labels: HH (Higher High), HL (Higher Low), etc., marking a bullish structure.
Price Projection Arrows: For forecasting move down → reversal → move up.
Boxes: Demand/supply zones.
📝 Conclusion:
This is a smart money concept (SMC) based analysis. Price is expected to:
Tap into a demand zone for a potential buy opportunity, and
Then target liquidity resting at the equal highs around $3,440.
Disclaimer
The information and publications are not meant to be, and do not constitute, financial, investment, trading, or other types of advice or recommendations supplied or endorsed by TradingView. Read more in the Terms of Use.
Disclaimer
The information and publications are not meant to be, and do not constitute, financial, investment, trading, or other types of advice or recommendations supplied or endorsed by TradingView. Read more in the Terms of Use.