Indicators for trading using Bill Williams' Profitunity strategy
I published 3 indicators for trading using Bill Williams' Profitunity strategy. For each indicator, I have added a visual and detailed description in English and Russian. In this post I will briefly describe these indicators and how I use them together.
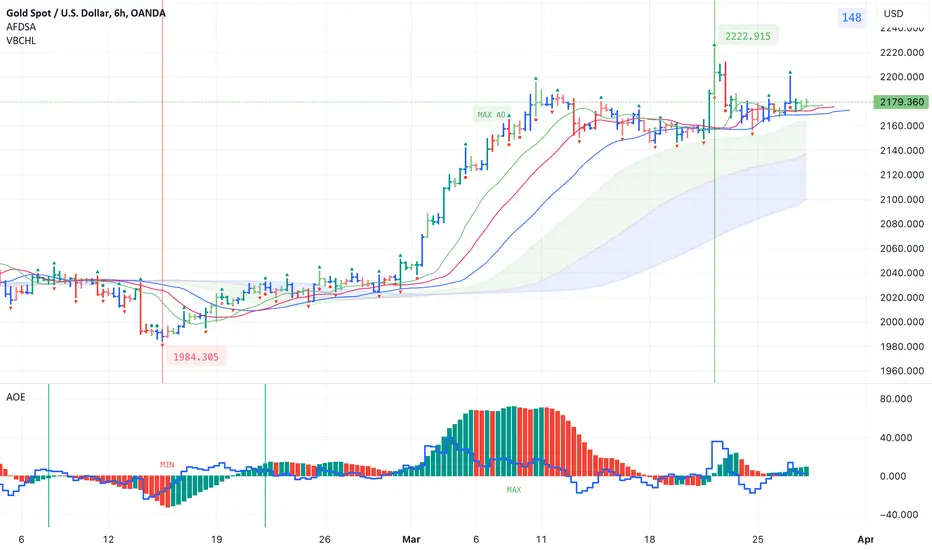
AFDSA indicator (Alligator + Fractals + Divergent & Squat Bars + Signal Alerts)
https://www.tradingview.com/script/Ainh222c-Alligator-Fractals-Divergent-Squat-Bars-Signal-Alerts/
Includes Williams Alligator, Williams Fractals, Divergent Bars, Market Facilitation Index, Highest and Lowest Bars, maximum or minimum peak of the Awesome Oscillator, and signal alerts based on Bill Williams' Profitunity strategy:

I also added an Alligator display for the higher timeframe, for example, if the chart timeframe is 1 hour, then the higher timeframe will automatically be 4 hours, if the chart timeframe is 4 hours, then the higher timeframe will be 1 day, etc.

AOE Oscillator (Awesome Oscillator + Bars count lines + EMA Line)
https://www.tradingview.com/script/5mbLfRcu-Awesome-Oscillator-Bars-count-lines-EMA-Line/
Includes the Awesome Oscillator with two vertical lines at a distance of 100 and 140 bars from the last bar to determine the third Elliott wave by the maximum peak of AO in the interval from 100 to 140 bars according to Bill Williams' Profitunity strategy. Additionally, a faster EMA line is displayed.
I also added display of the AO line for the lower timeframe instead of the EMA line if the Moving Average Line values (method, length and source) are equal to the Awesome Oscillator values in the indicator settings. For example, if the chart timeframe is 1 day, then the lower timeframe will automatically be 4 hours, if the chart timeframe is 4 hours, then the lower timeframe will be 1 hour, etc.

VBCHL indicator (Visible bars count on chart + highest/lowest bars, max/min AO)
https://www.tradingview.com/script/H9AHGJ8L-Visible-bars-count-on-chart-highest-lowest-bars-max-min-AO/
The indicator displays the number of visible bars on the screen, including the prices of the highest and lowest bars, the maximum or minimum value of the Awesome Oscillator. The values change dynamically when scrolling or changing the scale of the chart, but with a delay of several seconds, so this feature is included in a separate indicator so as not to slow down the work of other indicators.

Indicator settings
In the AFDSA indicator I use the following settings:
In the settings of the AOE oscillator, I enable the display of the AO line for the lower timeframe instead of the EMA line, setting the same values in the fields for the Moving Average Line (method, length and source) and Awesome Oscillator.
In the VBCHL indicator settings, I only enable the simple display text style for labels in the "Simple display text style for labels" field.
As a result, when analyzing the current chart, I immediately see all the signals on the chart, the location of the bars relative to the Alligator on the higher timeframe and changes in the Awesome Oscillator on the lower timeframe. And thanks to the VBCHL indicator, I quickly select the desired timeframe for analyzing the 5-wave Elliott impulse, focusing on the interval of 140 bars, and immediately see whether there is divergence between the maximum AO peak and the following lower AO peak in this interval.
AFDSA indicator (Alligator + Fractals + Divergent & Squat Bars + Signal Alerts)
https://www.tradingview.com/script/Ainh222c-Alligator-Fractals-Divergent-Squat-Bars-Signal-Alerts/
Includes Williams Alligator, Williams Fractals, Divergent Bars, Market Facilitation Index, Highest and Lowest Bars, maximum or minimum peak of the Awesome Oscillator, and signal alerts based on Bill Williams' Profitunity strategy:
- Bullish and Bearish Divergent Bar Signal + Squat Bar + Green Bar + Fake Bar + Awesome Oscillator Color Change + AO Divergence.
- Crossing the green line (Lips) of an open Alligator.
- Formation of a fractal.
- Signal about the breakdown of the last upper or lower fractal.
- Signal about the appearance of a new maximum or minimum peak of AO in the interval of 140 bars from the last bar.
I also added an Alligator display for the higher timeframe, for example, if the chart timeframe is 1 hour, then the higher timeframe will automatically be 4 hours, if the chart timeframe is 4 hours, then the higher timeframe will be 1 day, etc.
AOE Oscillator (Awesome Oscillator + Bars count lines + EMA Line)
https://www.tradingview.com/script/5mbLfRcu-Awesome-Oscillator-Bars-count-lines-EMA-Line/
Includes the Awesome Oscillator with two vertical lines at a distance of 100 and 140 bars from the last bar to determine the third Elliott wave by the maximum peak of AO in the interval from 100 to 140 bars according to Bill Williams' Profitunity strategy. Additionally, a faster EMA line is displayed.
I also added display of the AO line for the lower timeframe instead of the EMA line if the Moving Average Line values (method, length and source) are equal to the Awesome Oscillator values in the indicator settings. For example, if the chart timeframe is 1 day, then the lower timeframe will automatically be 4 hours, if the chart timeframe is 4 hours, then the lower timeframe will be 1 hour, etc.
VBCHL indicator (Visible bars count on chart + highest/lowest bars, max/min AO)
https://www.tradingview.com/script/H9AHGJ8L-Visible-bars-count-on-chart-highest-lowest-bars-max-min-AO/
The indicator displays the number of visible bars on the screen, including the prices of the highest and lowest bars, the maximum or minimum value of the Awesome Oscillator. The values change dynamically when scrolling or changing the scale of the chart, but with a delay of several seconds, so this feature is included in a separate indicator so as not to slow down the work of other indicators.
Indicator settings
In the AFDSA indicator I use the following settings:
- By default, the Squat Bar is colored blue, and all other bars are colored to match the Awesome Oscillator color, except for the Fake bars, which are colored with a lighter AO color. But I also enable the display of "Green" Divergent bars in the "Green Bars > Show" field.
- I enable the display of Alligator for higher timeframes in the "Alligator for higher timeframe > Enable" field.
- In the indicator style settings, I disable the display of the highest and lowest bars, maximum and minimum AO peak labels, because these labels are also displayed by the VBCHL indicator depending on the number of visible bars in the chart window.
- Only after opening a position, I enable all additional alerts in the “Enable all additional alerts” field (after changing this field, you need to re-create the alert for the current chart): crossing the green line of an open Alligator, formation of a fractal, appearance of a new maximum or minimum AO peak.
In the settings of the AOE oscillator, I enable the display of the AO line for the lower timeframe instead of the EMA line, setting the same values in the fields for the Moving Average Line (method, length and source) and Awesome Oscillator.
In the VBCHL indicator settings, I only enable the simple display text style for labels in the "Simple display text style for labels" field.
As a result, when analyzing the current chart, I immediately see all the signals on the chart, the location of the bars relative to the Alligator on the higher timeframe and changes in the Awesome Oscillator on the lower timeframe. And thanks to the VBCHL indicator, I quickly select the desired timeframe for analyzing the 5-wave Elliott impulse, focusing on the interval of 140 bars, and immediately see whether there is divergence between the maximum AO peak and the following lower AO peak in this interval.
Note
Added automatic display of Fibonacci Retracement, Trend-Based Fibonacci Extension and Trend-Based Fibonacci Time tools to the VBCHL indicator depending on the highest and lowest bars visible on the chart.Therefore, now I use additional settings in the VBCHL indicator.
In the "Auto Fib Retracement" settings block:
- I enable the display in the "✅" field.
- I place the values of Fibonacci levels on the chart to the right of the last bar, for which I check the "Extended lines right" field and select "Right" in the "Levels" field.
- I set a semi-transparent color to display Fibonacci levels that were not crossed by the price in the correction, for which I check the "Crossing levels" field.
- I hide the trend line, for which I set the "Trend" field to "0".
In the "Auto Trend-Based Fib Extension" settings block:
- I enable the display in the "✅" field.
- I hide the display of levels that are below the highest bar in an uptrend or above the lowest bar in a downtrend, for which I check the "Crossing levels" field. To prevent the levels from compressing the chart in height, in the chart settings I enable the "Scale price chart only" option.
In the "Auto Trend-Based Fib Time" settings block:
- I enable the display in the "✅" field
- I hide the display of levels that have been crossed by at least one bar, for which I check the "Crossing levels" field.
- I hide the background, for which I check the "Background" field.
I cannot automatically measure the distance between the peak of the 1st wave and the 3rd Elliott wave, and set it aside from the peak of the 2nd wave (the bottom of the 3rd) in order to timely target zones of 1.38 and 1.62 to determine the end of the 4th wave according to the strategy Profitunity. But I look for patterns by focusing on target zones while automatically measuring the distance from the lowest bar to the highest bar, with the zero line starting from the highest bar in an uptrend and from the lowest bar in a downtrend.
To display divergence on AO in correction on the chart, I check the "Display divergence on AO in correction" field.
As a result of such settings, the chart remains clean, I save myself from routine steps of plotting Fibonacci levels and immediately see correction levels and target zones on the chart, and also quickly find divergence in the correction.
Note
I added fractal filtration to the AFDSA indicator.That's why I now use an additional setting in the AFDSA indicator.
In the "Fractals > Filtration" field, I select the "high" value, i.e. a high filtration level:
- If the maximum of the highest bar of the upper fractal is above the Alligator lines, then the fractal will stand out, unlike the rest of the upper fractals, above which the triangle will be painted in a lighter color.
- If the minimum of the lowest bar of the lower fractal is below the Alligator lines, then the fractal will stand out, unlike the rest of the lower fractals, below which the triangle will be painted in a lighter color.
When the medium filtering level is enabled (the value "medium"):
- If the maximum of the highest bar of the upper fractal is above the red line (teeth) of the Alligator, then the fractal will stand out, unlike the rest of the upper fractals, above which the triangle will be painted in a lighter color.
- If the minimum of the lowest bar of the lower fractal is below the red line (teeth) of the Alligator, then the fractal will stand out, unlike the rest of the lower fractals, below which the triangle will be painted in a lighter color.
When any filtering level is enabled, if the last bar of the fractal is not closed (i.e. the fractal is not fully formed), then the triangle above the upper fractal or below the lower fractal will also be painted in a lighter color.
Also now in the indicator style settings I change the color of the squatting bars in accordance with the color of the Awesome Oscillator, i.e. instead of blue, I choose a darker red color for squat bars that match the red AO color, and I choose a darker green color for squat bars that match the green AO color.
Note
In the AFDSA indicator, I added the display of a horizontal line after the last upper fractal at the level of the maximum price of the bar and after the last lower fractal at the level of the minimum price of the bar, taking into account the filtering of fractals (excluding the upper fractals above which the triangle is painted in a lighter color and the lower fractals under which the triangle is painted in a lighter color). So now I enable displaying a horizontal line after the last upper or lower fractal in the indicator settings in the "Fractals > Display line after last filtered fractal" field (off by default), where you can also change the color, thickness and style of the line.
Also added an additional designation for the signal about the breakout of the last fractal:
- /// (three slashes), if the price is higher or lower than all Alligator lines when breaking through the maximum of the upper fractal or the minimum of the lower fractal, respectively.
- // (two slashes), if the price is above or below the red line (teeth) of the Alligator when breaking through the maximum of the upper fractal or the minimum of the lower fractal, respectively.
And the ability to enable short messages about signals in the settings, in which symbols are displayed instead of text, has been added, so now I check the "Enable short messages of notifications" field (off by default) in the indicator settings, which contains a hint describing the new format.
The AFDSA indicator description describes all the new changes in more detail.
Note
Updates in AFDSA indicatorAdded the ability to change the color of the "Green" bars (in the "Style" tab in the indicator settings) when enabling the display of "Green" Divergent bars or all "Green" bars in the indicator settings (in the "Green Bars > Show" field). By default, the color of Bullish DBs is green, Bearish DBs are red, the color of the remaining "Green" bars is green if the closing price is higher than or equal to the opening price, and red if vice versa.
Added display on the chart of divergence on AO in correction after the highest and lowest bars in the interval of 140 bars from the last bar. Display can be enabled in the indicator settings in the "Display divergence on AO in correction > ✅" field. But I use the VBCHL indicator for this.
Added filtering of notifications about the Divergent bar signal in the indicator settings in the "Divergent bars > Filtering notifications" field. So now I enable filtering of Fake and Fade bars ("Fade" value) - disable notifications about Fake bars and disable notifications about Fade bars if one of the two previous bars before the Fade bar is not a Squat bar.
The text of notifications now includes a designation of the trend direction between the price of the highest and lowest bars in the interval of 140 bars from the last bar after the timeframe designation and additional designations in case of a correction after the highest and lowest bars, which are described in detail in the description of the AFDSA indicator.
Also added a high volume bar signal — 📶/📶², if the bar volume is more than 40%/70% of the average volume value calculated using a simple moving average (SMA) in the interval of 140 bars from the last bar. So now I enable the high volume bar signal notification in the indicator settings in the "High volume bars > Enable alerts" field. Even if the notification is disabled, the signal designation is used in the text of other notifications, except for the notification about the formation of a fractal.
👀 Please note! If the indicator parameter is changed after the alert is created, then the alert will be triggered using the old settings. Thanks to this feature in TradingView, you can create alerts with different settings for different tickers and timeframes.
Now you can enable the display of the latest signals on the chart in the indicator settings in the "Display signals on chart" field.
Updates in AOE indicator
Added display of the last AO column for a higher timeframe, for example, if the chart timeframe is 1 hour, then the higher timeframe will automatically be 4 hours, if the chart timeframe is 4 hours, then the higher timeframe will be 1 day, etc. Therefore, now I enable display of the last AO column for a higher timeframe in the indicator settings in the "Display last column for higher timeframe > Enable" field. The display parameters are described in more detail in the AOE indicator description.
Settings in the VBCHL indicator
Now in the "Auto Trend-Based Fib Extension" settings block, in the "Point 3" field, I select the "Left highest/lowest bar" value (in the "Point 2" field, I leave the default value - "Highest/lowest bar on right") so that the distance from the lowest bar to the highest bar is automatically measured, but the zero point starts from the lowest bar in an uptrend and from the highest bar in a downtrend, and not vice versa, as in the default settings.
In this case, according to my observations, the target zones for determining the end of the 4th Elliott wave are most similar to the results of measurements according to the Profitunity strategy, when the distance between the peak of wave 1 and the peak of wave 3 is measured, and is set aside from the peak of wave 2. This makes it easier for me to look for patterns in order to focus on target zones when automatically measuring the distance.
Disclaimer
The information and publications are not meant to be, and do not constitute, financial, investment, trading, or other types of advice or recommendations supplied or endorsed by TradingView. Read more in the Terms of Use.
Disclaimer
The information and publications are not meant to be, and do not constitute, financial, investment, trading, or other types of advice or recommendations supplied or endorsed by TradingView. Read more in the Terms of Use.