📊From the daily chart, after the previous two weeks of decline and adjustment, gold prices were supported by the middle track of the Bollinger Bands and the MA moving average system, successfully breaking through the upper suppression zone and re-entering a strong upward phase. The technical side showed strong rebound repair momentum.
📊The current rebound structure started from the low point of 3200. According to the Fibonacci retracement calculation:
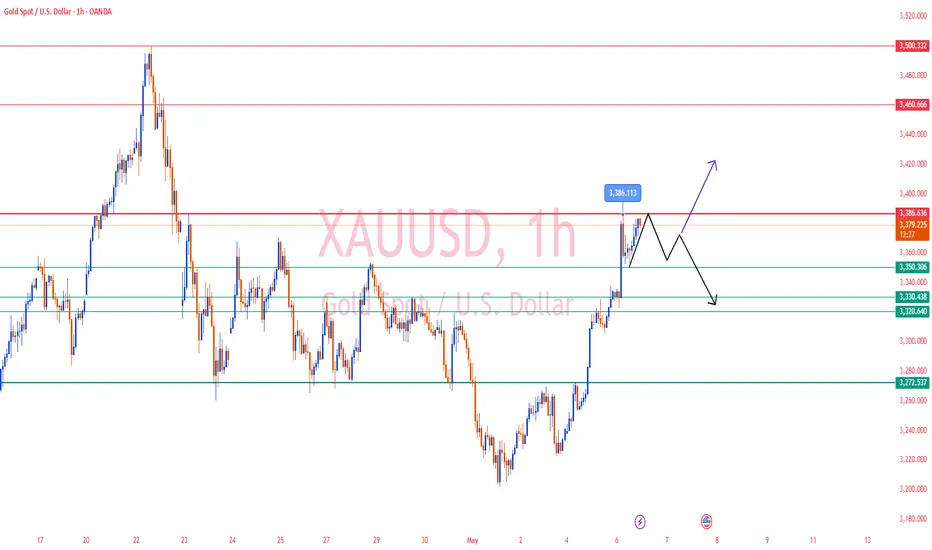
The 0.618 rebound level is around 3386, which is also an important technical suppression level where the current price is blocked;
🔴Resistance level: 3386-3390 Fibonacci 0.618 position + previous high suppression, if it breaks through, it will open up new high space
🟢Support level 1: 3350 Asian session low support, if it is lost, the short-term will weaken
🟢Support level 2: 3320-3300 hourly level strong support area, breaking will turn to short-selling power
🟢Medium-term key support: 3272 Previous low and structural support, if this position is not maintained, the rebound definition is established and the bulls will be denied
✅Gold touched 3386 in the morning and then fell back, with the lowest reaching 3350. If it continues to fluctuate in the 3386-3350 range before the European session, it is still expected to break through the upper pressure in the future and further open up the upward space (3400-3500); if the European session directly breaks the 3350 support, it is necessary to be alert that this round of rising market may end, and the market will return to the adjustment rhythm.
Disclaimer
The information and publications are not meant to be, and do not constitute, financial, investment, trading, or other types of advice or recommendations supplied or endorsed by TradingView. Read more in the Terms of Use.
Disclaimer
The information and publications are not meant to be, and do not constitute, financial, investment, trading, or other types of advice or recommendations supplied or endorsed by TradingView. Read more in the Terms of Use.