🟡 Chart Overview:
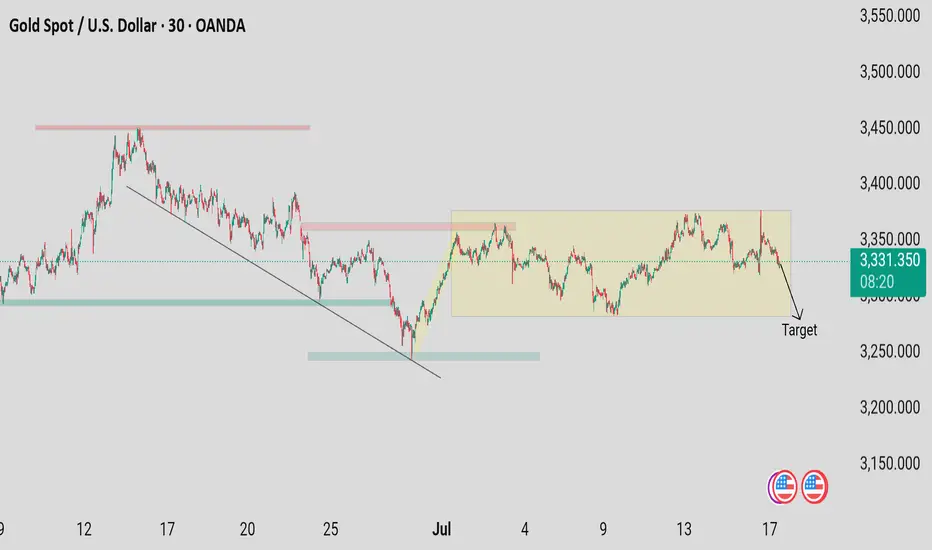
The image shows XAU/USD (Gold) price action breaking down from a bearish descending channel, signaling a continuation of downward momentum.
---
🔍 Technical Analysis:
1. Trend Structure:
The market was respecting a descending channel, consistently making lower highs and lower lows.
A clear break below the channel support indicates a strong bearish bias.
2. Key Breakdown Level:
The lower trendline of the channel was broken with strong momentum, showing sellers' dominance.
This is often followed by a retest of the broken trendline (as new resistance).
3. Support & Target Zones:
Immediate support zone: $2,390
Extended bearish target: $2,375–$2,365
These levels align with historical price reactions and Fibonacci confluences.
4. Volume & Candlestick Behavior:
Large-bodied bearish candles confirm strong sell pressure.
No signs of reversal (like hammer or bullish engulfing) yet.
---
✅ Conclusion & Strategy:
Bias: Bearish
Strategy: Wait for a minor pullback/retest of the broken channel, then consider short positions with tight stops.
Target Levels: $2,390 > $2,375
Stop Loss: Above the retest area, around $2,410–$2,415
Trade active
🔗 t.me/+VTrdWh5R_scwMGM0
✅ All PAIRS SIGNALS PROVIDE FIRST VISIT THEN JOIN
🔗 t.me/+jODseb0iIvxiNjc0
✅ REGISTER UNDER THE WORLD BEST BROKER
🔗 one.exnesstrack.org/a/6yzdfvn1po
✅ All PAIRS SIGNALS PROVIDE FIRST VISIT THEN JOIN
🔗 t.me/+jODseb0iIvxiNjc0
✅ REGISTER UNDER THE WORLD BEST BROKER
🔗 one.exnesstrack.org/a/6yzdfvn1po
Disclaimer
The information and publications are not meant to be, and do not constitute, financial, investment, trading, or other types of advice or recommendations supplied or endorsed by TradingView. Read more in the Terms of Use.