On the flip side, the $2,042-2,040 strong horizontal resistance breakpoint now seems to protect the immediate downside ahead of the 50-day Simple Moving Average (SMA), currently pegged near the $2,033-2,032 zone. A convincing break below the latter could drag the Gold price to the $2,012-2,010 area en route to the $2,000 psychological mark. Failure to defend the said support levels might shift the bias in favour of bearish traders and expose the 100-day SMA support near the $1,982 region, before the XAU/USD drops to the very important 200-day SMA, near the $1,965 area.
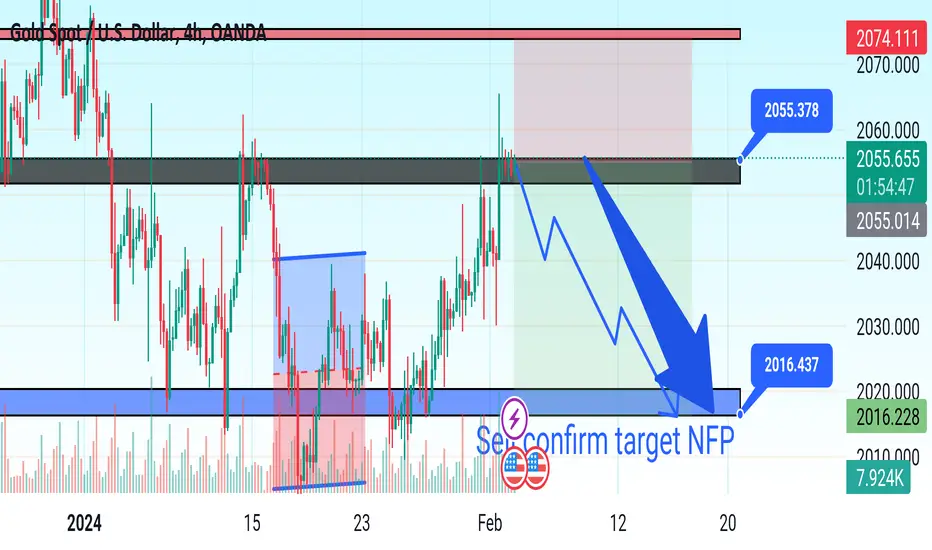
Gold sell 2055
Target 2016
Gold sell 2055
Target 2016
Note
260 pips runningNote
Full close sellNote
Enjoy free signalsNote
Follow My ChartNote
Support usDisclaimer
The information and publications are not meant to be, and do not constitute, financial, investment, trading, or other types of advice or recommendations supplied or endorsed by TradingView. Read more in the Terms of Use.
Disclaimer
The information and publications are not meant to be, and do not constitute, financial, investment, trading, or other types of advice or recommendations supplied or endorsed by TradingView. Read more in the Terms of Use.