XAUMO Weekly Report – March 9, 2025
Institution-Grade Gold (XAU/USD) Analysis
📌 Executive Summary
Gold (XAU/USD) remains in a structural uptrend, but near-term resistance is forming as China’s worsening deflation amplifies global economic uncertainty. The risk of Japanification—prolonged stagnation, deflation, and weak demand—raises concerns about capital outflows, which could drive safe-haven demand for gold.
This institution-grade report integrates macro drivers, multi-timeframe technical analysis, and SMA 14-based price projections to establish a high-confidence Fair Value Range Projection (FVRP) for the week ahead.
⸻
1️⃣ Macroeconomic Drivers & Market Sentiment
China’s Deflationary Shock: A Systemic Risk
🔻 CPI (-0.4%) and Core CPI (-0.2%) YoY: The first negative Core CPI print, highlighting deep-seated demand weakness.
🔻 PPI remains in contraction: Cost-push deflation is squeezing corporate margins, a signal of broad economic distress.
🔻 Weak Yuan & Stimulus Expectations: Capital outflows could further pressure the yuan, increasing gold’s appeal as a monetary hedge.
Implications for Gold:
✅ Gold thrives in deflationary uncertainty—any aggressive Chinese stimulus could push gold higher.
✅ USD strength is a risk factor—a liquidity-driven dollar rally may cap gold’s upside, especially if the Fed maintains its higher-for-longer stance.
⸻
2️⃣ Multi-Timeframe Technical Analysis
📌 Monthly Outlook
🔹 Trend: Strong macro uptrend, bullish structure intact.
🔹 Key Levels: Support at $2,850, resistance at $2,975.
🔹 Momentum: Stochastic nearing overbought—potential medium-term consolidation ahead.
📌 Weekly Outlook
🔹 FVRP (Fair Value Range Projection): $2,905 - $2,945
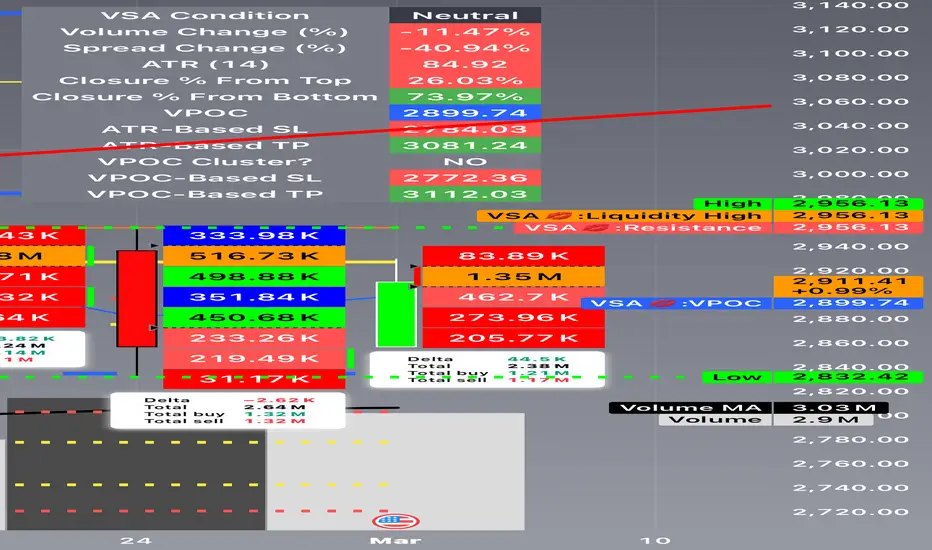
🔹 Resistance Zone: $2,956 - $2,975 (strong selling pressure expected).
🔹 Support Zone: $2,880 - $2,901 (key liquidity area).
📌 Daily Chart
🔹 Bullish trend but signs of exhaustion—lower volume on recent rallies.
🔹 Bearish divergence on RSI suggests a possible pullback.
📌 Hourly Structure
🔹 Price compression between $2,901 - $2,930—a breakout is imminent.
🔹 If $2,930 clears, next test is $2,960.
⸻
3️⃣ XAUMO Fair Value Range Projection (FVRP) for the Week
Bullish Breakout
Target $2,960 - $2,975
Likelihood 60%
Fair Value Range
$2,905 - $2,945
Likelihood 75%
Downside Risk
$2,880 - $2,901
Likelihood 65%
⸻
4️⃣ Institutional-Grade Trading Plan
📌 Primary Trade: Buy the Dip at Key Support
🔹 Order Type: Buy Limit
🔹 Entry: $2,905
🔹 Stop Loss: $2,880
🔹 Take Profit: $2,960
🔹 Confidence Level: 75%
📌 Justification:
• Liquidity pool at $2,901 - $2,905 aligns with strong buyer interest.
• China’s deflation risk supports safe-haven demand.
• Risk/reward favors accumulation before potential breakout.
⸻
📌 Alternative Trade: Fade the Breakout at Resistance
🔹 Order Type: Sell Limit
🔹 Entry: $2,960
🔹 Stop Loss: $2,975
🔹 Take Profit: $2,920
🔹 Confidence Level: 65%
📌 Justification:
• If momentum stalls at $2,960, expect profit-taking & short-term retracement.
• Bearish divergence on smaller timeframes hints at possible rejection.
• Key psychological barrier—institutions may offload long positions here.
⸻
5️⃣ SMA 14-Based Price Lock Analysis & Trading Strategy
📌 SMA 14 Lock Price Projection
• Daily Chart Estimate: $2,905 - $2,915, acting as a dynamic pivot zone.
• 4H & Hourly Charts: $2,911 - $2,920, aligning with current fair value levels.
📌 Key Takeaway:
✅ If price holds above SMA 14 ($2,905 - $2,915), uptrend remains intact.
❌ If price breaks below $2,905, expect a drop toward $2,880.
⸻
📌 SMA 14-Based Entry & Exit Strategies
🔹 Primary Trade: Buy on SMA 14 Retest for Trend Continuation
📌 Setup: If price pulls back to SMA 14 ($2,911 - $2,915) and holds, it’s a strong buy-the-dip opportunity in line with the prevailing uptrend.
🔹 Order Type: Buy Limit
🔹 Entry: $2,912 (optimal retest level)
🔹 Stop Loss: $2,905 (below recent support to avoid stop hunts)
🔹 Take Profit: $2,950 - $2,960 (previous resistance & liquidity zone)
🔹 Confidence Level: 80%
⸻
🔹 Alternative Trade: Short If SMA 14 Fails to Hold
📌 Setup: If SMA 14 ($2,911 - $2,915) fails to hold and price closes below $2,905, expect downside momentum toward the next liquidity pool.
🔹 Order Type: Sell Stop
🔹 Entry: $2,904 (confirmation of breakdown)
🔹 Stop Loss: $2,918 (above SMA 14 to avoid false breakouts)
🔹 Take Profit: $2,880 (previous support & demand zone)
🔹 Confidence Level: 70%
⸻
🔹 Breakout Strategy: Buy Above $2,920 If SMA 14 Becomes Support
📌 Setup: If price closes above $2,920 with strong volume, it confirms SMA 14 flipping into support.
🔹 Order Type: Buy Stop
🔹 Entry: $2,922 (breakout confirmation)
🔹 Stop Loss: $2,910 (below SMA 14 for risk control)
🔹 Take Profit: $2,960 (weekly resistance zone)
🔹 Confidence Level: 75%
⸻
6️⃣ Strategic Outlook: How to Play the Week
✅ Buy the dip at $2,905 → Target $2,960
✅ Sell if SMA 14 fails → Target $2,880
✅ Buy breakout if price clears $2,920 → Target $2,960
⸻
📌 Final Word: Tactical Execution is Key
SMA 14 is the battlefield for bulls & bears this week. Smartest move? Let price confirm direction before committing heavily.
💡 If you found this XAUMO Weekly Report valuable, support the research by boosting it & sharing it with our fellow traders
Institution-Grade Gold (XAU/USD) Analysis
📌 Executive Summary
Gold (XAU/USD) remains in a structural uptrend, but near-term resistance is forming as China’s worsening deflation amplifies global economic uncertainty. The risk of Japanification—prolonged stagnation, deflation, and weak demand—raises concerns about capital outflows, which could drive safe-haven demand for gold.
This institution-grade report integrates macro drivers, multi-timeframe technical analysis, and SMA 14-based price projections to establish a high-confidence Fair Value Range Projection (FVRP) for the week ahead.
⸻
1️⃣ Macroeconomic Drivers & Market Sentiment
China’s Deflationary Shock: A Systemic Risk
🔻 CPI (-0.4%) and Core CPI (-0.2%) YoY: The first negative Core CPI print, highlighting deep-seated demand weakness.
🔻 PPI remains in contraction: Cost-push deflation is squeezing corporate margins, a signal of broad economic distress.
🔻 Weak Yuan & Stimulus Expectations: Capital outflows could further pressure the yuan, increasing gold’s appeal as a monetary hedge.
Implications for Gold:
✅ Gold thrives in deflationary uncertainty—any aggressive Chinese stimulus could push gold higher.
✅ USD strength is a risk factor—a liquidity-driven dollar rally may cap gold’s upside, especially if the Fed maintains its higher-for-longer stance.
⸻
2️⃣ Multi-Timeframe Technical Analysis
📌 Monthly Outlook
🔹 Trend: Strong macro uptrend, bullish structure intact.
🔹 Key Levels: Support at $2,850, resistance at $2,975.
🔹 Momentum: Stochastic nearing overbought—potential medium-term consolidation ahead.
📌 Weekly Outlook
🔹 FVRP (Fair Value Range Projection): $2,905 - $2,945
🔹 Resistance Zone: $2,956 - $2,975 (strong selling pressure expected).
🔹 Support Zone: $2,880 - $2,901 (key liquidity area).
📌 Daily Chart
🔹 Bullish trend but signs of exhaustion—lower volume on recent rallies.
🔹 Bearish divergence on RSI suggests a possible pullback.
📌 Hourly Structure
🔹 Price compression between $2,901 - $2,930—a breakout is imminent.
🔹 If $2,930 clears, next test is $2,960.
⸻
3️⃣ XAUMO Fair Value Range Projection (FVRP) for the Week
Bullish Breakout
Target $2,960 - $2,975
Likelihood 60%
Fair Value Range
$2,905 - $2,945
Likelihood 75%
Downside Risk
$2,880 - $2,901
Likelihood 65%
⸻
4️⃣ Institutional-Grade Trading Plan
📌 Primary Trade: Buy the Dip at Key Support
🔹 Order Type: Buy Limit
🔹 Entry: $2,905
🔹 Stop Loss: $2,880
🔹 Take Profit: $2,960
🔹 Confidence Level: 75%
📌 Justification:
• Liquidity pool at $2,901 - $2,905 aligns with strong buyer interest.
• China’s deflation risk supports safe-haven demand.
• Risk/reward favors accumulation before potential breakout.
⸻
📌 Alternative Trade: Fade the Breakout at Resistance
🔹 Order Type: Sell Limit
🔹 Entry: $2,960
🔹 Stop Loss: $2,975
🔹 Take Profit: $2,920
🔹 Confidence Level: 65%
📌 Justification:
• If momentum stalls at $2,960, expect profit-taking & short-term retracement.
• Bearish divergence on smaller timeframes hints at possible rejection.
• Key psychological barrier—institutions may offload long positions here.
⸻
5️⃣ SMA 14-Based Price Lock Analysis & Trading Strategy
📌 SMA 14 Lock Price Projection
• Daily Chart Estimate: $2,905 - $2,915, acting as a dynamic pivot zone.
• 4H & Hourly Charts: $2,911 - $2,920, aligning with current fair value levels.
📌 Key Takeaway:
✅ If price holds above SMA 14 ($2,905 - $2,915), uptrend remains intact.
❌ If price breaks below $2,905, expect a drop toward $2,880.
⸻
📌 SMA 14-Based Entry & Exit Strategies
🔹 Primary Trade: Buy on SMA 14 Retest for Trend Continuation
📌 Setup: If price pulls back to SMA 14 ($2,911 - $2,915) and holds, it’s a strong buy-the-dip opportunity in line with the prevailing uptrend.
🔹 Order Type: Buy Limit
🔹 Entry: $2,912 (optimal retest level)
🔹 Stop Loss: $2,905 (below recent support to avoid stop hunts)
🔹 Take Profit: $2,950 - $2,960 (previous resistance & liquidity zone)
🔹 Confidence Level: 80%
⸻
🔹 Alternative Trade: Short If SMA 14 Fails to Hold
📌 Setup: If SMA 14 ($2,911 - $2,915) fails to hold and price closes below $2,905, expect downside momentum toward the next liquidity pool.
🔹 Order Type: Sell Stop
🔹 Entry: $2,904 (confirmation of breakdown)
🔹 Stop Loss: $2,918 (above SMA 14 to avoid false breakouts)
🔹 Take Profit: $2,880 (previous support & demand zone)
🔹 Confidence Level: 70%
⸻
🔹 Breakout Strategy: Buy Above $2,920 If SMA 14 Becomes Support
📌 Setup: If price closes above $2,920 with strong volume, it confirms SMA 14 flipping into support.
🔹 Order Type: Buy Stop
🔹 Entry: $2,922 (breakout confirmation)
🔹 Stop Loss: $2,910 (below SMA 14 for risk control)
🔹 Take Profit: $2,960 (weekly resistance zone)
🔹 Confidence Level: 75%
⸻
6️⃣ Strategic Outlook: How to Play the Week
✅ Buy the dip at $2,905 → Target $2,960
✅ Sell if SMA 14 fails → Target $2,880
✅ Buy breakout if price clears $2,920 → Target $2,960
⸻
📌 Final Word: Tactical Execution is Key
SMA 14 is the battlefield for bulls & bears this week. Smartest move? Let price confirm direction before committing heavily.
💡 If you found this XAUMO Weekly Report valuable, support the research by boosting it & sharing it with our fellow traders
لو عايز تبقى واحد من اللي بيفهموا في الدهب وبيكسبوا من السوق صح،
🎯 للدهب والفرص الحقيقية تابعنا من هنا:
For gold updates & smart trades 👇
t.me/GOLDontheNILE
You're welcome to join my Telegram channel
انضم وابقى من اللعيبة مش من الجمهور💰🔥
🎯 للدهب والفرص الحقيقية تابعنا من هنا:
For gold updates & smart trades 👇
t.me/GOLDontheNILE
You're welcome to join my Telegram channel
انضم وابقى من اللعيبة مش من الجمهور💰🔥
Disclaimer
The information and publications are not meant to be, and do not constitute, financial, investment, trading, or other types of advice or recommendations supplied or endorsed by TradingView. Read more in the Terms of Use.