🟡 Gold Weekly Outlook – Bullish Momentum Tested at Key Support
Welcome to a new trading week! Gold remains in a broader uptrend, though recent price action is testing a critical support zone that could define the next directional move.
🔹 Key Zone in Focus: $3,308
Gold is currently testing the $3,308 level, a major support area from previous consolidation. How price reacts here will shape the near-term outlook.
🔼 Upside Scenario (Rebound from $3,308):
$3,387 – Initial resistance and breakout target
$3,400 – Key psychological and structural level
$3,435 – Long-term resistance zone from weekly charts
🔽 Downside Scenario (Break below $3,308):
$3,290 – Minor support
$3,268 – Stronger demand zone with historical buying interest
Outlook: The bullish bias remains valid as long as Gold holds above $3,308. A daily close below would shift momentum to the downside, opening up lower support levels.
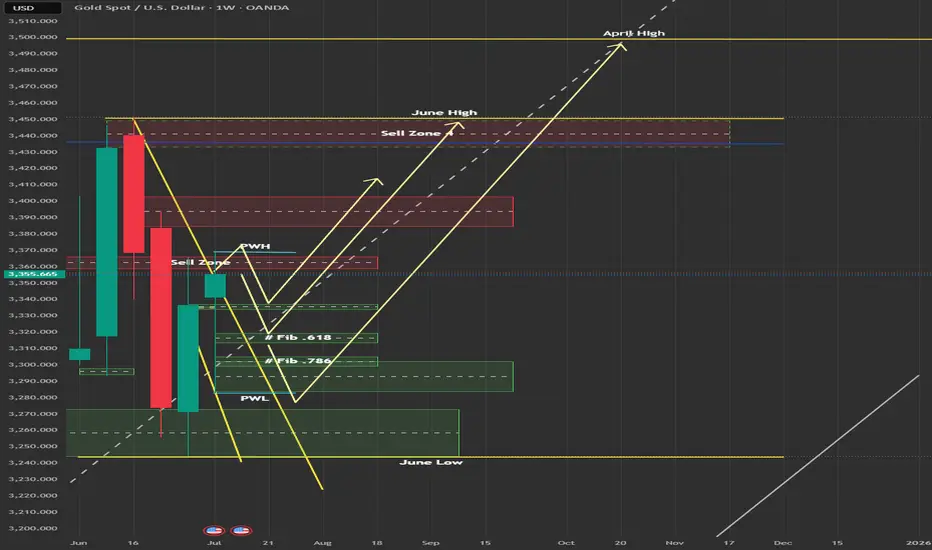
📉 Weekly Chart (High Timeframe Outlook)
Bias: Bullish, but signs of exhaustion are emerging
Current Candle: Bearish rejection forming after last week’s lower high
Trend: Still upward, but stalling inside a distribution-like pattern
Weekly Structure:
Major CHoCH in early 2023 triggered the ongoing uptrend
Price made a Higher High near $3,500, but it appears weak
Now consolidating inside a premium range, rejecting upper levels
🔑 Weekly Confluence Zones:
Type Price Zone Confluence Factors
🔼 Resistance $3,490–$3,500 Weak high + RSI divergence + FVG
🔼 Supply $3,450–$3,470 Imbalance fill + overextended EMA5
🔽 Support $3,355–$3,320 Weekly order block + FVG zone
🔽 Deep Demand $3,200–$3,170 Last strong demand + BOS origin
Fibonacci: 50% retracement sits near $3,250
Weekly RSI: Rolling over from overbought – potential early trend cracks
EMAs (5/21/50): Still bullish but flattening – short-term caution
🔍 Key Weekly Watchpoints:
Close above $3,470 → possible sweep into $3,500 resistance
Failure to hold $3,355–$3,320 → deeper drop toward $3,200
Watch for lower high formation inside premium = bearish shift
A bounce from $3,320 must be supported by volume and FVG reaction
📊 Daily Chart (D1) – Compression Near Supply
Bias: Neutral with rising bearish pressure
Trend: Still bullish overall, but compressing between supply and mid-range zones
Current Position:
Price capped below $3,395
Bearish CHoCH formed, but no daily BOS yet
EMAs are narrowing; RSI is flat → signs of indecision
🔑 Daily Zones to Watch:
Type Price Range Highlights
🔼 Supply $3,448–$3,465 Daily OB + EMA divergence + trap zone
🔼 LH OB $3,385–$3,395 Internal supply + EMA21 rejection
🔽 Mid FVG $3,328–$3,310 Fib midpoint + previous reaction zone
🔽 Strong OB $3,260–$3,245 Unmitigated OB + 61.8% fib retracement
Fibonacci: Pullback to $3,310 = mid-point of the last bullish impulse
EMAs (5/21/50): Bearish crossover, but no strong divergence
RSI: Neutral – awaiting price action confirmation
📌 Trade Scenarios:
Bearish: Rejection at $3,385–$3,395 → fall toward $3,310, then $3,245
Bullish: Clean break + retest above $3,395 → short squeeze into $3,460 liquidity
⏱️ 4H Chart – Intraday Bias: Bearish (Below $3,420)
Bias: Bearish unless price reclaims and holds above $3,420
Structure: Lower high formation likely; recent CHoCH may be inducement
Context: Filled FVGs + untested OBs in premium → caution warranted
RSI: Near exhaustion
🔼 Zones Above Price:
$3,445–$3,465 – Weak high + unfilled FVG = likely bull trap
$3,405–$3,420 – Lower high resistance zone; likely turning point
$3,360–$3,385 – Core supply from CHoCH + EMA21 dynamic resistance
🔽 Zones Below Price:
$3,340–$3,355 – Minor support; could break easily
$3,300–$3,280 – Key demand zone at 50% fib retracement
$3,240–$3,210 – Major support; origin of the last HL
$3,185–$3,160 – Final liquidity zone; break here would invalidate June rally
🎯 Intraday Trade Setups:
🔻 Bearish Setup (Preferred):
Rejection from $3,405–$3,420
Forms a lower high → clean drop toward $3,300
Confirmation: bearish engulfing or wick rejection on M30–H1
🔺 Bullish Breakout (Less Likely):
Strong break + hold above $3,420
Upside extension into $3,445–$3,465 zone
Must be supported by dovish macro events (e.g., soft CPI or FOMC tone)
Note: That zone remains weak liquidity, so not ideal for holding longs
📌 Final Word
Gold’s bullish trend is intact while price holds above $3,308, but momentum is slowing.
The battle between bulls and bears is happening in the $3,300–$3,395 range. A break outside this zone will likely define the trend for the week ahead.
Stay disciplined, watch for key confirmations, and manage risk carefully.
Welcome to a new trading week! Gold remains in a broader uptrend, though recent price action is testing a critical support zone that could define the next directional move.
🔹 Key Zone in Focus: $3,308
Gold is currently testing the $3,308 level, a major support area from previous consolidation. How price reacts here will shape the near-term outlook.
🔼 Upside Scenario (Rebound from $3,308):
$3,387 – Initial resistance and breakout target
$3,400 – Key psychological and structural level
$3,435 – Long-term resistance zone from weekly charts
🔽 Downside Scenario (Break below $3,308):
$3,290 – Minor support
$3,268 – Stronger demand zone with historical buying interest
Outlook: The bullish bias remains valid as long as Gold holds above $3,308. A daily close below would shift momentum to the downside, opening up lower support levels.
📉 Weekly Chart (High Timeframe Outlook)
Bias: Bullish, but signs of exhaustion are emerging
Current Candle: Bearish rejection forming after last week’s lower high
Trend: Still upward, but stalling inside a distribution-like pattern
Weekly Structure:
Major CHoCH in early 2023 triggered the ongoing uptrend
Price made a Higher High near $3,500, but it appears weak
Now consolidating inside a premium range, rejecting upper levels
🔑 Weekly Confluence Zones:
Type Price Zone Confluence Factors
🔼 Resistance $3,490–$3,500 Weak high + RSI divergence + FVG
🔼 Supply $3,450–$3,470 Imbalance fill + overextended EMA5
🔽 Support $3,355–$3,320 Weekly order block + FVG zone
🔽 Deep Demand $3,200–$3,170 Last strong demand + BOS origin
Fibonacci: 50% retracement sits near $3,250
Weekly RSI: Rolling over from overbought – potential early trend cracks
EMAs (5/21/50): Still bullish but flattening – short-term caution
🔍 Key Weekly Watchpoints:
Close above $3,470 → possible sweep into $3,500 resistance
Failure to hold $3,355–$3,320 → deeper drop toward $3,200
Watch for lower high formation inside premium = bearish shift
A bounce from $3,320 must be supported by volume and FVG reaction
📊 Daily Chart (D1) – Compression Near Supply
Bias: Neutral with rising bearish pressure
Trend: Still bullish overall, but compressing between supply and mid-range zones
Current Position:
Price capped below $3,395
Bearish CHoCH formed, but no daily BOS yet
EMAs are narrowing; RSI is flat → signs of indecision
🔑 Daily Zones to Watch:
Type Price Range Highlights
🔼 Supply $3,448–$3,465 Daily OB + EMA divergence + trap zone
🔼 LH OB $3,385–$3,395 Internal supply + EMA21 rejection
🔽 Mid FVG $3,328–$3,310 Fib midpoint + previous reaction zone
🔽 Strong OB $3,260–$3,245 Unmitigated OB + 61.8% fib retracement
Fibonacci: Pullback to $3,310 = mid-point of the last bullish impulse
EMAs (5/21/50): Bearish crossover, but no strong divergence
RSI: Neutral – awaiting price action confirmation
📌 Trade Scenarios:
Bearish: Rejection at $3,385–$3,395 → fall toward $3,310, then $3,245
Bullish: Clean break + retest above $3,395 → short squeeze into $3,460 liquidity
⏱️ 4H Chart – Intraday Bias: Bearish (Below $3,420)
Bias: Bearish unless price reclaims and holds above $3,420
Structure: Lower high formation likely; recent CHoCH may be inducement
Context: Filled FVGs + untested OBs in premium → caution warranted
RSI: Near exhaustion
🔼 Zones Above Price:
$3,445–$3,465 – Weak high + unfilled FVG = likely bull trap
$3,405–$3,420 – Lower high resistance zone; likely turning point
$3,360–$3,385 – Core supply from CHoCH + EMA21 dynamic resistance
🔽 Zones Below Price:
$3,340–$3,355 – Minor support; could break easily
$3,300–$3,280 – Key demand zone at 50% fib retracement
$3,240–$3,210 – Major support; origin of the last HL
$3,185–$3,160 – Final liquidity zone; break here would invalidate June rally
🎯 Intraday Trade Setups:
🔻 Bearish Setup (Preferred):
Rejection from $3,405–$3,420
Forms a lower high → clean drop toward $3,300
Confirmation: bearish engulfing or wick rejection on M30–H1
🔺 Bullish Breakout (Less Likely):
Strong break + hold above $3,420
Upside extension into $3,445–$3,465 zone
Must be supported by dovish macro events (e.g., soft CPI or FOMC tone)
Note: That zone remains weak liquidity, so not ideal for holding longs
📌 Final Word
Gold’s bullish trend is intact while price holds above $3,308, but momentum is slowing.
The battle between bulls and bears is happening in the $3,300–$3,395 range. A break outside this zone will likely define the trend for the week ahead.
Stay disciplined, watch for key confirmations, and manage risk carefully.
Disclaimer
The information and publications are not meant to be, and do not constitute, financial, investment, trading, or other types of advice or recommendations supplied or endorsed by TradingView. Read more in the Terms of Use.
Disclaimer
The information and publications are not meant to be, and do not constitute, financial, investment, trading, or other types of advice or recommendations supplied or endorsed by TradingView. Read more in the Terms of Use.