
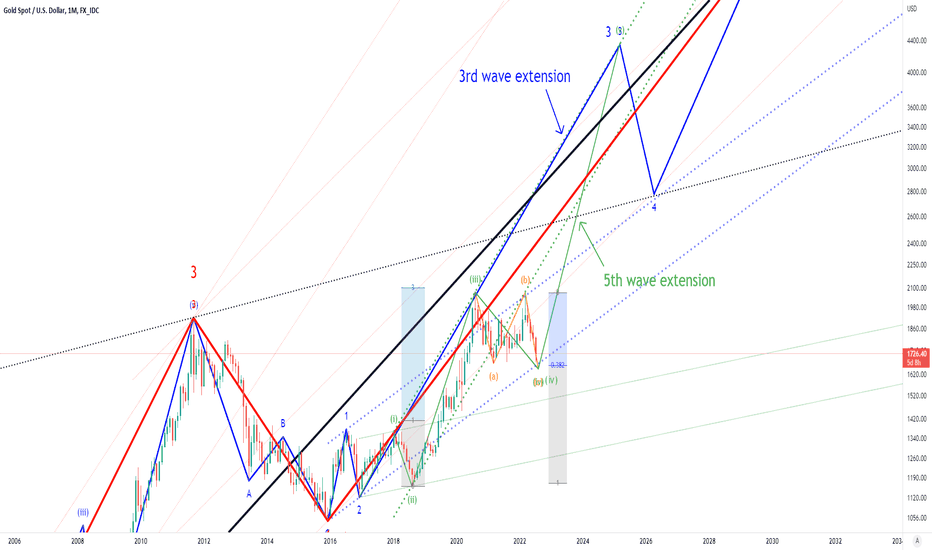
■Outlook of XAUUSD on 3D chart.
I think we are on the wave(ⅳ) shown as a Green-line.
Sub-waves of Wave(ⅳ) are shown by Orange line.
I think sub-waves of Wave(ⅳ) are probably "Regular Flat pattern ((a), (b), (c))".
The sub-waves of Wave(a),(b), and (c) are shown by Black lines.
Sub-wave of wave(c) is probably an Impulse (ⅰ,ⅱ,ⅲ,ⅳ,ⅴ).
If the assumption of this scenario is correct,
We are probably on sub-wave ⅴ of Wave (c).
Sub-wave ⅴof wave (ⅳ) will be completed shortly.
The wave(ⅳ) will grow to Wave (ⅲ)'s Fibonacci level of 38.2%.
so, Target is 1,620 to 1670.
In this scenario, the stop loss level is 1600.
After Wave ⅴ is completed, Wave (ⅴ) on the upper degree will start.
Wave (ⅴ) will probably be a 5th wave extension impulse.
Last time my idea.
■Jul 24, 2022. Long term analysis.
■May 28, 2022. Short term analysis.

■Mar 21, 2022. Short term analysis.

■Feb 13, 2022. Short term analysis.

I think we are on the wave(ⅳ) shown as a Green-line.
Sub-waves of Wave(ⅳ) are shown by Orange line.
I think sub-waves of Wave(ⅳ) are probably "Regular Flat pattern ((a), (b), (c))".
The sub-waves of Wave(a),(b), and (c) are shown by Black lines.
Sub-wave of wave(c) is probably an Impulse (ⅰ,ⅱ,ⅲ,ⅳ,ⅴ).
If the assumption of this scenario is correct,
We are probably on sub-wave ⅴ of Wave (c).
Sub-wave ⅴof wave (ⅳ) will be completed shortly.
The wave(ⅳ) will grow to Wave (ⅲ)'s Fibonacci level of 38.2%.
so, Target is 1,620 to 1670.
In this scenario, the stop loss level is 1600.
After Wave ⅴ is completed, Wave (ⅴ) on the upper degree will start.
Wave (ⅴ) will probably be a 5th wave extension impulse.
Last time my idea.
■Jul 24, 2022. Long term analysis.
■May 28, 2022. Short term analysis.
■Mar 21, 2022. Short term analysis.
■Feb 13, 2022. Short term analysis.
Disclaimer
The information and publications are not meant to be, and do not constitute, financial, investment, trading, or other types of advice or recommendations supplied or endorsed by TradingView. Read more in the Terms of Use.
Disclaimer
The information and publications are not meant to be, and do not constitute, financial, investment, trading, or other types of advice or recommendations supplied or endorsed by TradingView. Read more in the Terms of Use.