📌 Market Context & Sentiment Overview
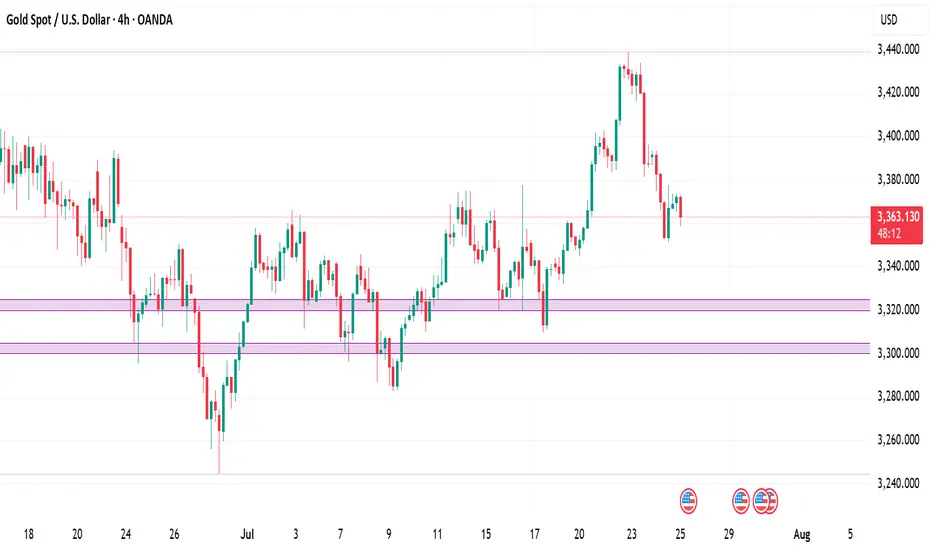
The gold market is currently trading in a state of technical compression, with the price hovering just beneath the mid-3360s. After a significant rally earlier in the month, the recent sessions have seen price action coiling within a tight ascending triangle—a classic pattern known to precede breakouts.
According to recent publications by FXEmpire, FXStreet, and Investing.com, sentiment remains moderately bullish. Analysts point to strong institutional demand near the 3320–3330 zone, while also warning of resistance pressures near the 3380–3390 zone. These insights align with our technical findings, which suggest a developing structure with increasing breakout potential.
📊 Technical Structure Analysis (4-Hour Timeframe)
🔹 Price Action & Structural Patterns
The prevailing structure is a rising triangle anchored between support at 3320 and resistance near 3380–3390. Price has been forming higher lows, indicative of underlying buying pressure, while simultaneously facing resistance at increasingly frequent tests of the upper band. The contraction of candlestick bodies and volume confirms the presence of a coiling market—hinting at an imminent directional move.
The presence of upper-wick rejections near 3380 signals seller interest, while long-tailed candles at 3330 underscore buyer defense of the rising trendline. This dynamic equilibrium is the hallmark of a triangle formation nearing completion.
🔹 Support & Resistance Levels
Our analysis identifies the following zones as technically significant:
Key Support (Buy Zones):
3320–3330: This zone hosts a major bullish order block, 8/21 EMAs, and the lower trendline of the rising triangle. It is further supported by the 61.8% Fibonacci retracement drawn from the 3300 low to the 3390 swing high.
3300–3310: A psychological level and previous 4-hour swing low. Acts as a secondary defense level.
Key Resistance (Sell Zones):
3380–3390: Triangle resistance, aligned with the 50 EMA and a bearish order block.
3440–3450: An upper extension zone if breakout materializes, noted in external institutional outlooks.
🔹 Volume, VWAP & Institutional Concepts
Volume has notably contracted, a classical feature of triangle formations, with most trading volume aggregating at the mid-point (~3345–3355). VWAP sits just below the current price, reflecting mean reversion tendencies. Furthermore, liquidity pockets are observed just beneath 3320, suggesting potential for liquidity grabs before a bullish reversal.
From a Smart Money lens:
A bullish order block has formed near 3320–3330.
A bearish OB and resistance cap prices around 3380.
A small Fair Value Gap (FVG) lies around 3340–3350, acting as a potential price magnet.
🔹 Indicators & Oscillators
Moving Averages: The 8/21 EMA cluster lies just below current price, offering dynamic support.
MACD: Negative but converging—suggesting bearish momentum may be waning.
ADX: Reading ~40, indicating a trending market, though momentum has slightly slowed.
RSI: Hovering near 35–40, close to oversold; signals potential bounce.
Stochastics & CCI: Both deeply negative—supporting the case for a mean-reverting move.
🎯 Strategic Buying & Selling Zones
✅ High-Probability Buy Zones
3320–3330:
Rationale: Confluence of bullish OB, rising trendline, EMAs, and Fib 61.8%.
Confidence: High (★ ★ ★)
3300–3310 (buffer zone):
Rationale: Psychological and historical swing low support.
Confidence: Moderate
❌ High-Probability Sell Zones
3380–3390:
Rationale: Triangle resistance, prior highs, and bearish OB presence.
Confidence: High
3440–3450:
Rationale: Post-breakout measured move target and potential take-profit zone.
Confidence: Moderate
🏆 The Golden Setup: High-Conviction Trade Idea
Direction: Long
Entry: 3325
Stop Loss: 3300
Take Profit: 3390
Confidence Level: ★ ★ ★ (High)
🔍 Justification
This setup takes advantage of the strongest structural support within the triangle—centered around 3325. This level is reinforced by the 61.8% Fibonacci retracement, bullish order block activity, and EMA compression, all coalescing with the triangle’s rising support line.
Indicators are turning from oversold, and the volume profile suggests that institutional players may look to engineer a liquidity sweep under 3330 before a continuation push to test the 3380 resistance. The reward-to-risk ratio is favorable, and the setup offers clear invalidation with a tight stop at 3300.
Should momentum continue post-breakout, a secondary TP could be explored at 3440. However, for the purpose of tactical execution, 3390 is a strategically sound exit point.
🧠 Sentiment Cross-Check & Market Alignment
External sentiment and professional forecasts support the underlying thesis of a bullish breakout, pending confirmation. TradingView’s top technical authors emphasize the breakout of this ascending triangle toward 3440+, while Investing.com’s shorter-term signals reflect bearish pressure that aligns with our buy-the-dip strategy.
This synthesis of internal and external analysis increases our conviction in a long-biased tactical approach from the current support zone.
✅ Summary Table
Buy Zones Sell Zones Golden Setup
3320–3330 (primary) 3380–3390 (primary) Direction: Long
3300–3310 (buffer) 3440–3450 (extension) Entry: 3325
Stop Loss: 3300
Take Profit: 3390
Confidence Level: ★ ★ ★ (High)
🔚 Final Thoughts
Gold’s current price structure presents a rare opportunity—one defined by tight consolidation, structural clarity, and institutional footprints. As the market coils within a classic triangle, the 3320–3330 zone emerges as a high-probability springboard for long positions. With precise risk management and a disciplined approach, this setup offers traders a compelling entry with defined technical boundaries.
The golden rule now: Respect structure. React to confluence. Trade with conviction.
Disclaimer
The information and publications are not meant to be, and do not constitute, financial, investment, trading, or other types of advice or recommendations supplied or endorsed by TradingView. Read more in the Terms of Use.
Disclaimer
The information and publications are not meant to be, and do not constitute, financial, investment, trading, or other types of advice or recommendations supplied or endorsed by TradingView. Read more in the Terms of Use.