Gold prices rose, hitting another record high as heightened tariff uncertainty and bets on the Federal Reserve's loosening of monetary policy kept the metal attractive. Spot gold rose 1.46% to $2,972.80 an ounce at press time, reaching an intraday high of $2,978.33, surpassing the previous record high of $2,956.15 set in February. Gold prices could soar to an unprecedented $3,500 an ounce in the third quarter as investors flock to safe-haven assets amid heightened geopolitical tensions. It is predicted that gold prices could average $3,150 an ounce between July and September. Concerns about a possible shutdown of the U.S. federal government also weighed on the market as Senate Democrats failed to agree on a temporary funding bill on Wednesday, adding to uncertainty.
Meanwhile, the weakening of US inflation data further reinforced the market's expectations of a rate cut by the Federal Reserve. The US CPI data for February released on Wednesday showed that the overall inflation rate fell from 3% in January to 2.8%, lower than market expectations; the core CPI (excluding food and energy) rose 3.1% year-on-year, also down from 3.3% in January. This data boosted the market's confidence in the Fed's loose policy, and some traders even expected the Fed to cut interest rates by 25 basis points in June, July and October respectively. The rising expectations of rate cuts directly depressed US Treasury yields. Although the US dollar index rebounded slightly from its low since October 16, it still lacked strong momentum for a strong counterattack overall. This environment provides significant support for non-interest-bearing gold.
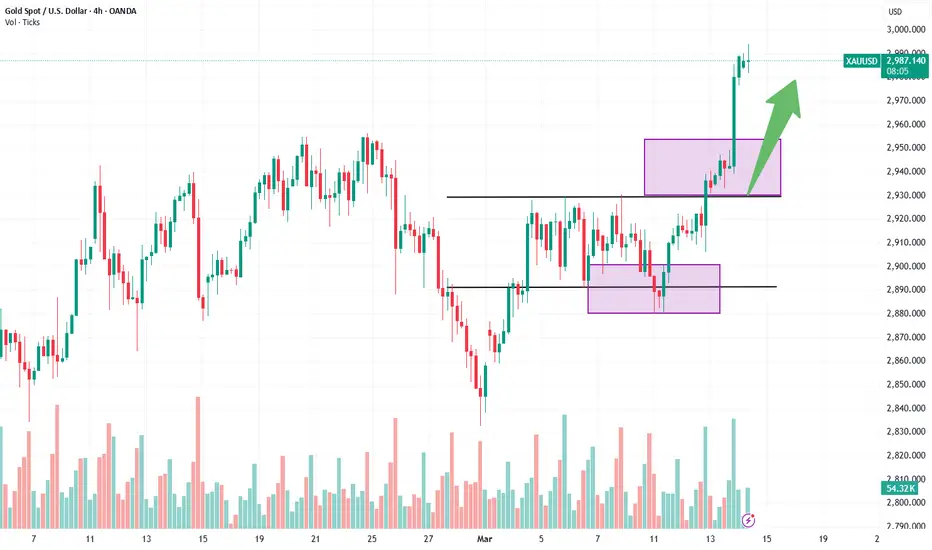
Technical analysis of gold: On Thursday, gold in the U.S. market pushed upward and broke through the high. The price broke through the high of 2956 and then accelerated to rise. The current high is 2978. This position is 100% of the previous round of rise and expansion, which belongs to the resistance area. Pay attention to whether it can suppress the bulls. The amplitude after breaking the high is larger than expected. After gold broke through 2930 yesterday, gold bulls were strong, and no longer the same volatile market as before. Gold bulls began to exert their strength, and gold began to go long in reverse. Gold was directly long at 2933 today, and the article also directly and publicly suggested going long at 2933. Gold rose and harvested. Gold fell back to around 2940 in the U.S. market and continued to go long. Gold rose again and harvested. Gold went long in reverse and won three consecutive victories.
In the short term, the current increase of more than 40 US dollars throughout the day is obviously very risky. Going long is also against the trend. The trend belongs to the bulls. The 1-hour moving average of gold continues to cross upward and the bulls are arranged and divergent. The gold bulls are in high spirits. Today we have been emphasizing that gold falling back to 2930 is an opportunity to buy on dips. The gold bulls will become more and more fierce. Gold will rise directly when it falls back to 2939 in the US market. The US market directly breaks the historical high of 2956. Then gold will continue to buy when it falls back to 2956 in the future. Gold is likely to hit a new record high again and go to 2985. Gold has now broken through the shock range, so there is obviously a trend change. Then the only way is to follow the trend and go long. Going with the trend is light and fluttering, and going against the trend is messy. On the whole, the short-term operation strategy of gold today is recommended to focus on callbacks and short rebounds. The short-term focus on the 3000-3010 resistance line on the upper side and the short-term focus on the 2975-2965 support line on the lower side.
Meanwhile, the weakening of US inflation data further reinforced the market's expectations of a rate cut by the Federal Reserve. The US CPI data for February released on Wednesday showed that the overall inflation rate fell from 3% in January to 2.8%, lower than market expectations; the core CPI (excluding food and energy) rose 3.1% year-on-year, also down from 3.3% in January. This data boosted the market's confidence in the Fed's loose policy, and some traders even expected the Fed to cut interest rates by 25 basis points in June, July and October respectively. The rising expectations of rate cuts directly depressed US Treasury yields. Although the US dollar index rebounded slightly from its low since October 16, it still lacked strong momentum for a strong counterattack overall. This environment provides significant support for non-interest-bearing gold.
Technical analysis of gold: On Thursday, gold in the U.S. market pushed upward and broke through the high. The price broke through the high of 2956 and then accelerated to rise. The current high is 2978. This position is 100% of the previous round of rise and expansion, which belongs to the resistance area. Pay attention to whether it can suppress the bulls. The amplitude after breaking the high is larger than expected. After gold broke through 2930 yesterday, gold bulls were strong, and no longer the same volatile market as before. Gold bulls began to exert their strength, and gold began to go long in reverse. Gold was directly long at 2933 today, and the article also directly and publicly suggested going long at 2933. Gold rose and harvested. Gold fell back to around 2940 in the U.S. market and continued to go long. Gold rose again and harvested. Gold went long in reverse and won three consecutive victories.
In the short term, the current increase of more than 40 US dollars throughout the day is obviously very risky. Going long is also against the trend. The trend belongs to the bulls. The 1-hour moving average of gold continues to cross upward and the bulls are arranged and divergent. The gold bulls are in high spirits. Today we have been emphasizing that gold falling back to 2930 is an opportunity to buy on dips. The gold bulls will become more and more fierce. Gold will rise directly when it falls back to 2939 in the US market. The US market directly breaks the historical high of 2956. Then gold will continue to buy when it falls back to 2956 in the future. Gold is likely to hit a new record high again and go to 2985. Gold has now broken through the shock range, so there is obviously a trend change. Then the only way is to follow the trend and go long. Going with the trend is light and fluttering, and going against the trend is messy. On the whole, the short-term operation strategy of gold today is recommended to focus on callbacks and short rebounds. The short-term focus on the 3000-3010 resistance line on the upper side and the short-term focus on the 2975-2965 support line on the lower side.
Disclaimer
The information and publications are not meant to be, and do not constitute, financial, investment, trading, or other types of advice or recommendations supplied or endorsed by TradingView. Read more in the Terms of Use.
Disclaimer
The information and publications are not meant to be, and do not constitute, financial, investment, trading, or other types of advice or recommendations supplied or endorsed by TradingView. Read more in the Terms of Use.