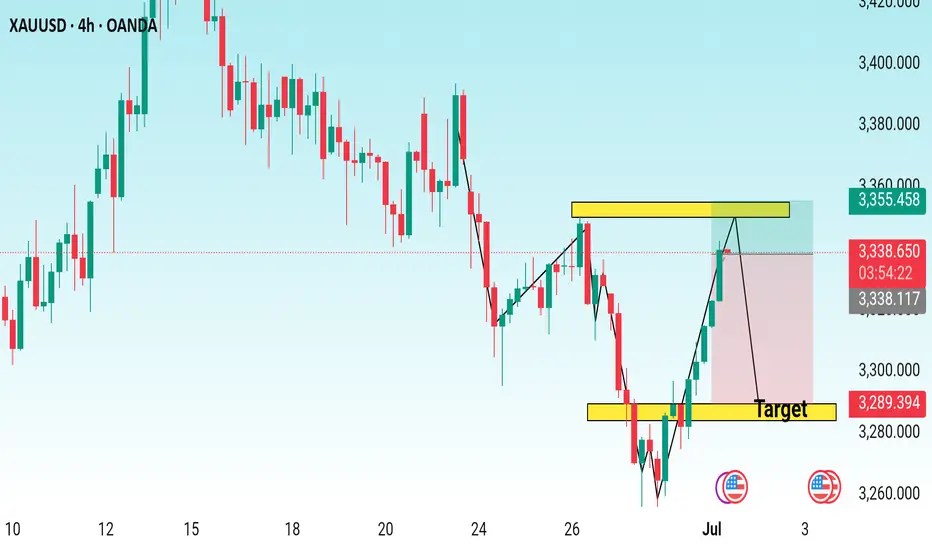
This is a 4-hour candlestick chart of XAUUSD (Gold vs. US Dollar) from TradingView, showing technical analysis for a potential short (sell) trade setup. Here’s a breakdown of what the chart indicates:
---
🔍 Key Observations:
1. Chart Pattern:
The chart shows a Bearish Reversal Pattern forming after a rally.
A clear double-top or supply zone (resistance) is marked near 3,355.458 (highlighted in yellow).
The price has reached this resistance zone and is expected to reverse downwards.
2. Trade Setup:
Entry Point: Near the resistance zone (~3,355).
Stop Loss: Slightly above the resistance zone.
Target: The lower yellow zone around 3,289.394, which appears to be a prior support zone.
This creates a Risk-Reward setup, where risk (stop loss) is defined above resistance and the reward is targeted at support.
3. Indicators:
No indicators like RSI, MACD, or moving averages are shown – this is a price action-based setup.
The chart uses simple price structure, zones, and candlestick formations.
4. Timeframe:
4-hour chart – suitable for short- to mid-term trading decisions.
Timing suggests that a reaction might be imminent or ongoing from the resistance level.
5. Fundamental Reminder:
US flags at the bottom suggest that economic events or news from the U.S. are expected around this time, possibly Non-Farm Payroll (NFP) or Fed-related news, which could impact XAUUSD volatility.
---
✅ Conclusion:
This chart suggests a short trade opportunity in XAUUSD, targeting a move from around 3,355 down to 3,289, using a bearish reversal from resistance. The setup relies on historical price zones and potential rejection from resistance.
Would you like a risk/reward ratio or trade plan based on this setup?
---
🔍 Key Observations:
1. Chart Pattern:
The chart shows a Bearish Reversal Pattern forming after a rally.
A clear double-top or supply zone (resistance) is marked near 3,355.458 (highlighted in yellow).
The price has reached this resistance zone and is expected to reverse downwards.
2. Trade Setup:
Entry Point: Near the resistance zone (~3,355).
Stop Loss: Slightly above the resistance zone.
Target: The lower yellow zone around 3,289.394, which appears to be a prior support zone.
This creates a Risk-Reward setup, where risk (stop loss) is defined above resistance and the reward is targeted at support.
3. Indicators:
No indicators like RSI, MACD, or moving averages are shown – this is a price action-based setup.
The chart uses simple price structure, zones, and candlestick formations.
4. Timeframe:
4-hour chart – suitable for short- to mid-term trading decisions.
Timing suggests that a reaction might be imminent or ongoing from the resistance level.
5. Fundamental Reminder:
US flags at the bottom suggest that economic events or news from the U.S. are expected around this time, possibly Non-Farm Payroll (NFP) or Fed-related news, which could impact XAUUSD volatility.
---
✅ Conclusion:
This chart suggests a short trade opportunity in XAUUSD, targeting a move from around 3,355 down to 3,289, using a bearish reversal from resistance. The setup relies on historical price zones and potential rejection from resistance.
Would you like a risk/reward ratio or trade plan based on this setup?
t.me/goldsignalsclub3
Join my telegram for free signals link in below
t.me/goldsignalsclub3
Join my telegram for free signals link in below
t.me/goldsignalsclub3
Disclaimer
The information and publications are not meant to be, and do not constitute, financial, investment, trading, or other types of advice or recommendations supplied or endorsed by TradingView. Read more in the Terms of Use.
t.me/goldsignalsclub3
Join my telegram for free signals link in below
t.me/goldsignalsclub3
Join my telegram for free signals link in below
t.me/goldsignalsclub3
Disclaimer
The information and publications are not meant to be, and do not constitute, financial, investment, trading, or other types of advice or recommendations supplied or endorsed by TradingView. Read more in the Terms of Use.