📌 General Context
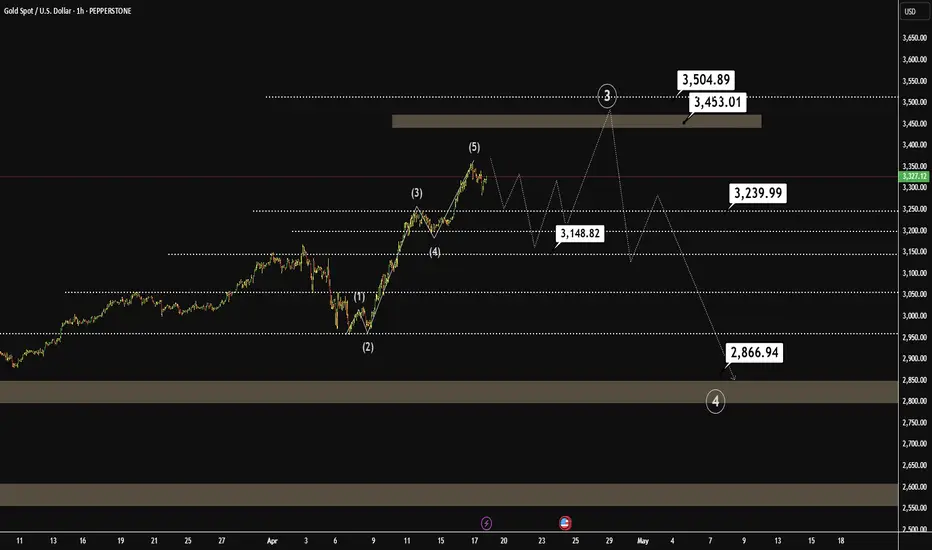
Gold (XAU/USD) is currently at a pivotal moment after completing a 5-wave impulsive sequence, suggesting that we may be about to enter a major corrective phase. The structure observed is an impulsive wave (1)-(2)-(3)-(4)-(5), which is typically followed by an ABC correction or a complex correction, depending on the larger context.
📈 Wave Structure and Technical Projection
Wave (5) Completed:
The end of wave (5) has clearly been marked, suggesting short-term buyer exhaustion.
This paves the way for a corrective movement that, based on wave projections, could seek much lower levels.
Critical Supply Zone:
Between $3,453.01 and $3,504.89, there is an important supply zone.
This area could act as resistance in a potential final bullish impulse to form an expanded "Flat" or "Running Flat" corrective structure.
Downside Projection (Wave 4 of Major Degree):
First support levels:
$3,239.99 (intermediate validation level)
$3,147.28 (previous structure)
Final projected correction target:
$2,866.94, coinciding with a strong demand zone and relevant technical support.
🧠 Technical Narrative
The price has been in a strongly bullish trend, but after completing a clear impulsive structure and approaching a significant supply zone, a significant correction is anticipated. This analysis is based on Elliott Wave Theory, complemented by Fibonacci levels and institutional supply/demand zones.
The projection suggests that gold could make a final rally to $3,450-$3,500, and from there initiate a deep correction toward the $2,866 area, where there is a technical support confluence.
🚨 Key Levels to Watch
Type Level
3,504.89 Supply Zone (maximum resistance)
3,453.01 Supply Zone (start)
3,239.99 Bearish Validation Level
3,147.28 Intermediate Support
2,866.94 Correction Target (potential buy zone)
🔔 Conclusion
The current structure suggests a high probability of a correction in gold after this strong bullish momentum. The most likely scenario is a correction toward $2,866, an area that could offer a new medium-term buying opportunity if validated by price action.
🕰️ Recommended follow-up to confirm reversal patterns and manage risk in case of trading this potential correction.
🧾 Trade Plan (Short)
🔹 Ideal Sell Zone:
Between $3,453.01 and $3,504.89 (institutional supply zone)
Look for reversal patterns (bearish engulfing candles, pin bars, M-patterns, RSI/MACD divergences)
🔹 Suggested Entry:
Step-level entry between $3,460 and $3,500
🔹 Stop Loss:
Above $3,550 (last previous high + protection)
🔹 Take Profits:
TP1: $3,239.99
TP2: $3,147.28
TPF: $2,866.94
🔹 Estimated Risk/Reward:
R:B from 1:4 to 1:6, depending on management and execution
💡 Strategy Alternative (Conservative)
Wait for confirmation of a bearish structure (such as a double top or a breakout of the previous low) before entering, with a tighter stop but less exposure.
🔔 Trading Summary
Value Element
Entry $3,460 – $3,500 (supply zone)
Stop Loss > $3,550
TP1 $3,239.99
TP2 $3,147.28
TP Final $2,866.94
💬 Do you like this approach? Do you have a different count? Share it in the comments!
#XAUUSD #Gold #TradingPlan #Wave4 #ShortSetup #ElliottWave #Fibonacci #SupplyZone #SwingTrade #TechnicalAnalysis #TradingIdeas
Note
Disclaimer
The information and publications are not meant to be, and do not constitute, financial, investment, trading, or other types of advice or recommendations supplied or endorsed by TradingView. Read more in the Terms of Use.
Disclaimer
The information and publications are not meant to be, and do not constitute, financial, investment, trading, or other types of advice or recommendations supplied or endorsed by TradingView. Read more in the Terms of Use.