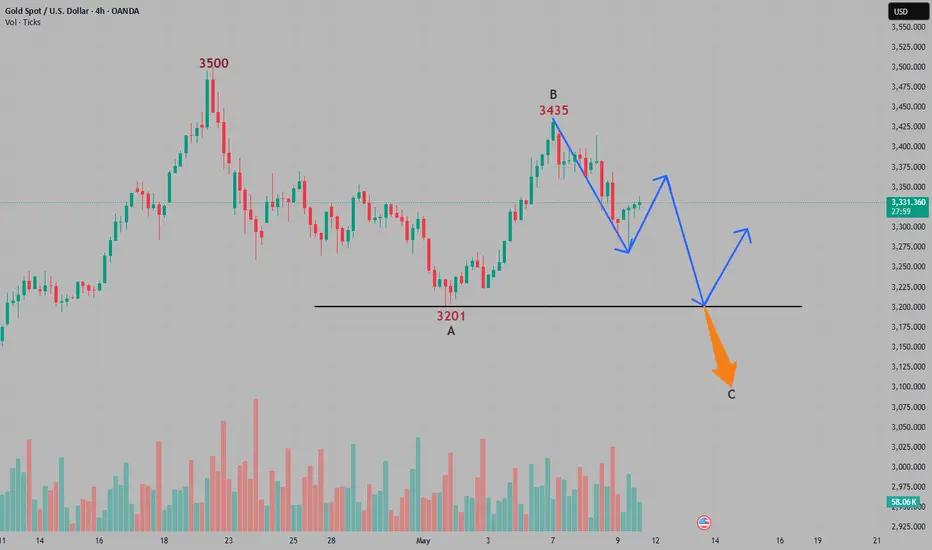
From a technical point of view, the daily line has risen and fallen for the second time, and the K line has two consecutive negative lines. This situation has definitely weakened, but whether the market will continue in the future needs to be observed. Today's weekly line closed, and the weekly line competition was fierce. There were signs of a second high pressure, and the upper shadow line was closed. If it can close at the current position or lower, the weekly line will leave an upper shadow line, forming a double needle top with the previous 3500 high point, then the adjustment space of the weekly line will be further deepened, and the lower side may be seen to 3260, 3200. However, if the daily line turns positive on Friday, it can also turn strong at any time. After all, the current price is just near the middle track of the daily Bollinger line, and both ups and downs are possible.
Pay attention to today's closing situation at the 4-hour level. The price is temporarily around 3300. If it continues to fall, the lower Bollinger band will open, which may form a one-sided rebound. If the Bollinger band closes, it will rise strongly again. Therefore, it is difficult to say the specific rise and fall situation for the time being. It is recommended to observe more to see whether the Asian and European sessions will continue to break the new low of 3274, and the upper pressure is 3350. In the morning, gold rose first and then fell, and it was quite fierce. It is recommended not to chase orders. First pay attention to the 3274 support. If it does not break, try to go long. If it breaks, it will go to the 3252 low. It is expected that gold will fluctuate on Friday, and trading will be mainly short-term.
Pay attention to today's closing situation at the 4-hour level. The price is temporarily around 3300. If it continues to fall, the lower Bollinger band will open, which may form a one-sided rebound. If the Bollinger band closes, it will rise strongly again. Therefore, it is difficult to say the specific rise and fall situation for the time being. It is recommended to observe more to see whether the Asian and European sessions will continue to break the new low of 3274, and the upper pressure is 3350. In the morning, gold rose first and then fell, and it was quite fierce. It is recommended not to chase orders. First pay attention to the 3274 support. If it does not break, try to go long. If it breaks, it will go to the 3252 low. It is expected that gold will fluctuate on Friday, and trading will be mainly short-term.
The passage to the door of wealth
Welcome to join us and make profits together
t.me/+fkCVmo8SFiJkMDZk
Welcome to join us and make profits together
t.me/+fkCVmo8SFiJkMDZk
Disclaimer
The information and publications are not meant to be, and do not constitute, financial, investment, trading, or other types of advice or recommendations supplied or endorsed by TradingView. Read more in the Terms of Use.