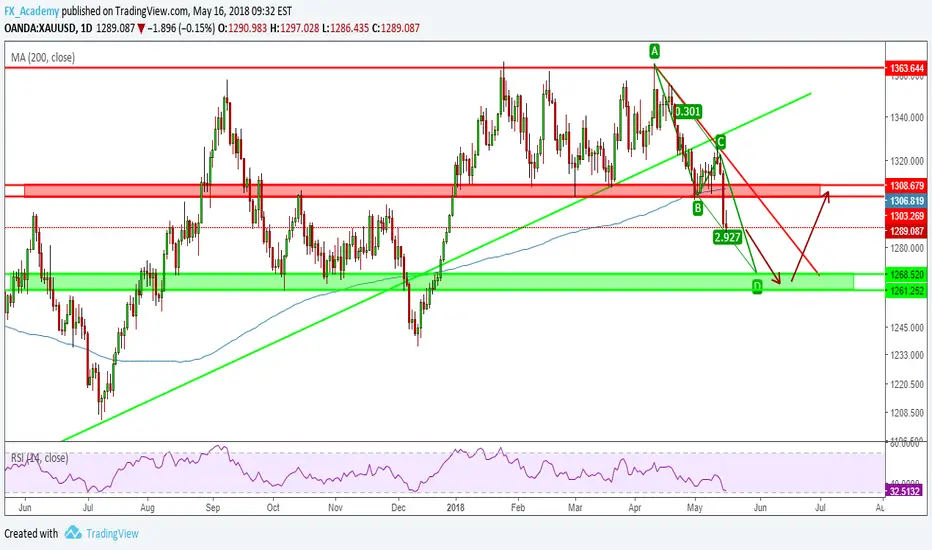
on the daily chart, we can see that the price has broken a key support levels 1308.6-1306.8 followed by the lower trend line from the high of 2018
so, the price si expected to continue its bearish movement to the support area 1268.5-1261.25
then, as shown there the harmonic pattern AB=CD will be completed with oversold in RSI, to take the price back up again and break the lower trend line to the resistance levels
so, the price si expected to continue its bearish movement to the support area 1268.5-1261.25
then, as shown there the harmonic pattern AB=CD will be completed with oversold in RSI, to take the price back up again and break the lower trend line to the resistance levels
Disclaimer
The information and publications are not meant to be, and do not constitute, financial, investment, trading, or other types of advice or recommendations supplied or endorsed by TradingView. Read more in the Terms of Use.
Disclaimer
The information and publications are not meant to be, and do not constitute, financial, investment, trading, or other types of advice or recommendations supplied or endorsed by TradingView. Read more in the Terms of Use.