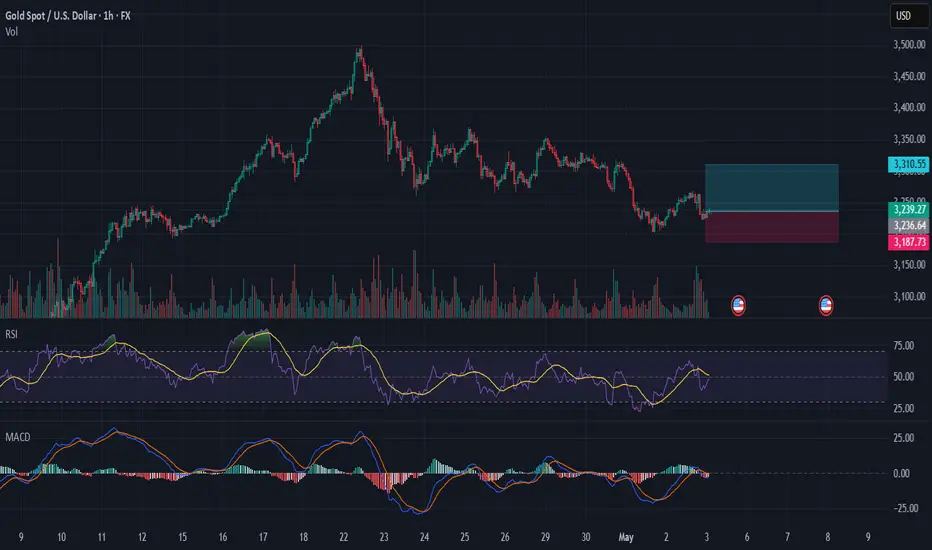
This setup is based on a combination of technical indicators and key support levels, which suggest a potential bullish movement in the near future.
Chart Analysis:
Price Action: The price of gold has been consolidating around the $3,230 level, forming a potential support zone. This consolidation phase often precedes a breakout, and we are looking for a bullish breakout from this range.
Volume: The volume indicator shows a decrease in selling pressure, which is a positive sign. Increased volume on upward price movements would confirm the bullish sentiment.
RSI (Relative Strength Index): The RSI is currently hovering around the 50 level, indicating a neutral momentum. However, a break above 50 would signal bullish momentum, and we are looking for a move towards the overbought zone (above 70).
MACD (Moving Average Convergence Divergence): The MACD line is approaching a bullish crossover with the signal line, which is a strong indication of a potential upward trend. The histogram is also showing positive divergence, adding to the bullish case.
Support and Resistance Levels: Key support levels are marked at $3,187.75 and $3,236.44. A break above these levels would confirm the bullish setup. Resistance levels are at $3,310.55 and $3,379.27, which could act as targets for the long position.
Trade Setup:
Entry: Look for a bullish breakout above the $3,236.44 support level.
Stop Loss: Place a stop loss below the recent low at $3,187.75.
Target: Aim for the resistance levels at $3,310.55 and $3,379.27.
I invite all traders to share their thoughts and insights on this setup. Your feedback and additional analysis can help refine this strategy and improve our collective understanding of the market. Let's discuss the potential outcomes and any additional indicators or patterns that could support or contradict this setup.
Don't forget to follow me for more detailed analyses and trade setups. Together, we can navigate the markets and capitalize on profitable opportunities.
Happy Trading! 🚀💸
Disclaimer
The information and publications are not meant to be, and do not constitute, financial, investment, trading, or other types of advice or recommendations supplied or endorsed by TradingView. Read more in the Terms of Use.
Disclaimer
The information and publications are not meant to be, and do not constitute, financial, investment, trading, or other types of advice or recommendations supplied or endorsed by TradingView. Read more in the Terms of Use.
