Following the news announcement, the XAUUSD market jumped and reached the resistance zone/equal highs level. Currently, the price is testing the previous week's high and may close higher. Historically, the market has frequently broken and closed above a crucial level on the third or fourth attempt. Given the present positive momentum, the price could rise to the 3000 mark this week. If the price pulls back, it may form an ascending triangle, which is a trend continuation pattern. Overall, I expect the market to continue its upward trend. My target is the resistance zone around 2975.
The market set a new all-time high by breaking and finishing above the previous week's high. The price has now reached the next resistance zone, 2950. As expected, the market broke through the resistance zone on the third attempt. However, we should proceed with caution at this point, as the market may fall below the previous week's high and enter a period of consolidation. This is especially important considering the forthcoming release of Unemployment Claims data, which may affect price movements. Despite this, I predict the price to rise, as the last daily candle formed a doji, signaling market momentum. My target is a resistance zone about 2974.
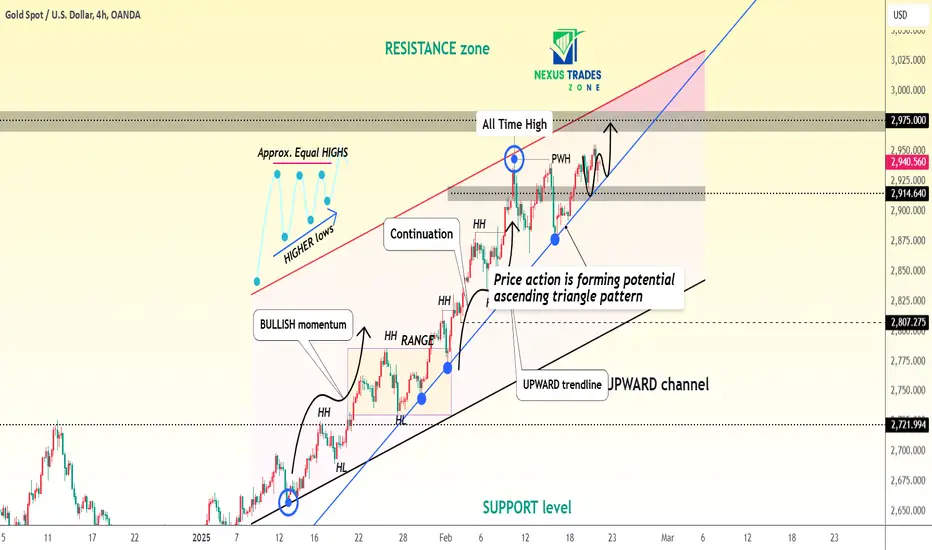
📊 Timeframe: 4H
💰 Current Price: $2,941
📈 Trend: Uptrend
Market Overview:
Gold has been consistently making higher highs (HH) and higher lows (HL), confirming a strong bullish trend. Price action is currently inside an ascending triangle pattern, signaling a potential breakout to the upside.
Key Levels to Watch:
✅ Resistance Zone: $2,975 – $3,000 (All-Time High)
✅ Support Levels: $2,914 - $2,920 (Current Support), $2,807 (Stronger Support)
✅ Uptrend Confirmation: Price holding above the blue upward trendline
Technical Pattern:
🔹 Ascending Triangle: Price action is forming a series of higher lows while resistance remains steady, indicating a buildup for a possible breakout.
🔹 Upward Channel: Gold remains within a broader bullish channel, further supporting the uptrend.
Trade Plan:
🔹 Bullish Scenario:
If price breaks above $2,975, expect a strong rally toward $3,000+
A successful retest of $2,914 could be an entry for another upward move
🔻 Bearish Scenario:
A breakdown below the trendline support ($2,914) may lead to a correction towards $2,807 - $2,721
The market set a new all-time high by breaking and finishing above the previous week's high. The price has now reached the next resistance zone, 2950. As expected, the market broke through the resistance zone on the third attempt. However, we should proceed with caution at this point, as the market may fall below the previous week's high and enter a period of consolidation. This is especially important considering the forthcoming release of Unemployment Claims data, which may affect price movements. Despite this, I predict the price to rise, as the last daily candle formed a doji, signaling market momentum. My target is a resistance zone about 2974.
📊 Timeframe: 4H
💰 Current Price: $2,941
📈 Trend: Uptrend
Market Overview:
Gold has been consistently making higher highs (HH) and higher lows (HL), confirming a strong bullish trend. Price action is currently inside an ascending triangle pattern, signaling a potential breakout to the upside.
Key Levels to Watch:
✅ Resistance Zone: $2,975 – $3,000 (All-Time High)
✅ Support Levels: $2,914 - $2,920 (Current Support), $2,807 (Stronger Support)
✅ Uptrend Confirmation: Price holding above the blue upward trendline
Technical Pattern:
🔹 Ascending Triangle: Price action is forming a series of higher lows while resistance remains steady, indicating a buildup for a possible breakout.
🔹 Upward Channel: Gold remains within a broader bullish channel, further supporting the uptrend.
Trade Plan:
🔹 Bullish Scenario:
If price breaks above $2,975, expect a strong rally toward $3,000+
A successful retest of $2,914 could be an entry for another upward move
🔻 Bearish Scenario:
A breakdown below the trendline support ($2,914) may lead to a correction towards $2,807 - $2,721
Related publications
Disclaimer
The information and publications are not meant to be, and do not constitute, financial, investment, trading, or other types of advice or recommendations supplied or endorsed by TradingView. Read more in the Terms of Use.
Related publications
Disclaimer
The information and publications are not meant to be, and do not constitute, financial, investment, trading, or other types of advice or recommendations supplied or endorsed by TradingView. Read more in the Terms of Use.