
This drop today put one more twist in this route, but it's not obvious that blue will win yet. This is because price can still reverse to yellow route. The rule here says until bold black line breaks, yellow should be favorite. This is technically true. But From 1 hour bar, the writing is on the wall that says 3000 won't come until second half of March. Which means that the following retrace should be 2770.
This would be enough to cap the final high at 3666 and force the low to test very long term mean average at 2166. So final stats for this draft are:
- swing up starts 3/20 or later
- with the low coming in at 2770-2790 is BLUE ROUTE
- FOR YELLOW ROUTE, 2870 MUST HOLD FROM HERE THROUGH 03/25
- medium-long math favors yellow
- daily/weekly favors blue
- my call is blue
- there are 2 highs, a May/June high and an august high
- May/June high is 3250-ish (very late May, very early June) same for yellow/blue
- August high is 3658-ish but I chose 3666 so it's easy to remember
- final low depends on high
- if high is 3777+ then low will be 2222-2415
- if high is 3666- then low should come in 2160-2222
- and low should hit before Thanksgiving or 11/25-ish
- this post is labeled as long bc we have to do the +875 first
- but the MAIN IDEA is 1500 retrace (doesn't matter which high 3500-4000)
- in a very small time frame (like 110 days total)
FROM HERE ON OUT -
- chart at top is the ENTIRE RANGE OF 2-WAY VOL
- which means that whatever the final route is...
- will either look like yellow or blue OR IN THE MIDDLE OF BOTH
- in the previous 3 posts, I've thoroughly discussed the data
- for very long, long term, medium term, etc...
- if you want back ground links are on this page somewhere
- but from here on out
- this page is dedicated only to 22-min and 8-min bar coverage
- or daily price action within context of chart at top
- we start with THE BREAK OF THE CURRENT BULL TREND
- or bold black line in chart at top pointing past 3666
Note
Note
CONTINUOUS COVERAGE1) first important date is next Tuesday
2) that's bears' only window to break black trend line
3) chart above BLUE ROUTE NEEDS UNDER 2855
4) by NEXT TUESDAY
5) to have 3000 hold at top channel
6) when bulls attack top of channel a third time
7) will add notes when I can
Note
8) 4:32 PM 2916.xx, so at top of this page I wrote that until black line breaks9) this move still favor yellow route
10) which is:
Note
11) this is last note I wrote before this post: Note
12) so we already did 2890, and now moving for 3030 13) because bears don't have enough to break that line yet
14) so in the chart before this one from my phone, that yellow move looks like this
Note
Note
15) so in chart above is why I said my call was blue even though black line has NOT BROKEN16) so the call is:
a) to 3030 by 3/15
b) break black line to 2890 again
c) bounce to 3000 by 3/25
d) then we hit the moment of truth 3/25, do we follow gray route (best fit yellow route)?
e) or do we check down to 2790
17) this is THE ONLY QUESTION LEFT BEFORE MOVING FOR 3100 AND 32XX
18) my call is red route in chart above to 5/20
19) which means price starts out yellow route to 3/25
20) and then blue rest of way to 5/20
21) there is WAY TOO MUCH NOISE to get beyond that to make a call
22) but remember how this works
23) it's either yellow or blue OR BOTH (in the middle)
24) I just think a 3025-3040 top is ASKING FOR 2780-2790 check down
Note
25) this is so very early to say26) but I think at 5/21-ish, it switches back to yellow again
27) this will all make sense when you replay chart at top in December
Note
Note
1) so yesterday I wrote that bears' only window to stop a high over 3000
2) is BY NEXT TUESDAY
3) what is meant by this is to cap the ceiling for March under 3000
4) bears needed to make 2855 by next Tuesday
5) bc bounce after that would stall without challenging top of channel at 3023++
6) this matters bc to get to 2790, bears NEED TO SET UP FOR IT
7) they DO NOT HAVE ONE YET
8) then I wrote that until black line breaks yellow should be favored
9) then showed what that would mean with red route
10) which is yellow changing tongue after 3/25
11) this will NOT WORK for bears... that route will hold at 2865 OR HIGHER
12) so bears only window is NOW TO TUESDAY
13) examination of 8-min bar shows bears have a 40% shot
14) at 2855 BY MID DAY MONDAY
Note
9/26, 10:10 AM ET, so if you look at the chart right above last one 15) where I wrote "-moving for 3030", and so on...
16) the black line was not hit yesterday
17) this WAS WRONG bc I moved it somehow lately by accident
18) well from 30-min bar:
Note
Note
Note
40) the short term actual move is rarely what we want 41) but we can definitely get tight limits for it, because remember...
42) if you zoom WAY OUT like this:
Note
43) Note
44) and the reason I called blue route when I wrote this post at the beginning 45) is because BLUE ROUTE IS THE ONLY PATTERN WE GET A TOP 3555-3666
46) why does this matter?
46) I have a VERY VERY LONG TERM SIGNAL that say the check after the high
47) should be 2160-2222, which is under the 45-year line at 2415-2425
48) to have a realistic shot of getting under the 45-year line
49) price needs to top at 3666 or less
50) after 3666 it's 3777 (low 23xx), 3850 (low 2425), 3970 (low 2480-25xx)
Note
Note
Note
74) that's the last time I will dwell into long and very long term notes75) and I had to, to explain the meaning in blues vs yellow/orange/red hi-lights
76) and their effects on highs and lows for August and November (or later, as late as Valentines Day 2026)
77) when we hit the low, whether that bre 2160-25xx (entire range of outcomes)
78) THIS WILL BE THE LAST ENTRY FOR 25000
79) there is only one outcome I have not clarified
80) that is if price decides to move in 4xxx FIRST
81) which would mean 4600 but should be closer to 5100
82) the only way that would be realistic is:
Note
Note
Note
83) so dark blue I made into skinny light blue84) it IS still leading and has about 36 hours OR LESS to break under 2890
85) AND IT MUST STAY THERE, IF NOT...
86) 86 updated orange is favorite THE REST OF THE WAY
Note
Note
Note
Note
2/27 8:10 AM ET, in chart above as long as bears1) hold momentum towards 2822
2) those 32-36 trading hours they have stay 32-36 hours
3) I will explain why later
Note
4) this is not saying bears are favored for anything under 28555) they are not, but they have a shot or the door is open for 2822
6) but it IS A VERY TIGHT WINDOW
Note
Note
continuing in chart above...1) 2770 is off the table
2) 2790 is a prayer
3) the only thing on the table under 2816 is 2810-ish
4) the two rectangles represent the two most bearish windows
5) in theory they CAN GET HIT
6) but we are talking 1-2% odds
Note
7) what that means is that8) THE ENTRY FOR 3530-3970 IS NEXT 8-18 DAYS
Note
Note
Note
Note
1) in chart above, I can now prove that base case should be 3777-2555 2) and I don't know if 3777 will hold it
Note
02/27/2025 - 7:29 PM ET - STOP EVERYTHING BECAUSE THE CEILING IS GOING TO BREAK: Note
1) if you've have been following me since november2) I expected a move to 3850-4100 but MUCH SLOWER, not like this
3) when price broke through 2866, I said that
4) if it moves this fast, it's moving for 4600, 4800, 5100 ...
5) but unlike all the other times before when I made these massive calls
6) I was going to make price prove it first
7) well right now, it's undeniable
8) we are moving for 3970 in May
9) and that changes everything
Note
11 PM ET... BE AWARE that price may have bottomed alreadyNote
... after 2861.Note
1) 8 min bar shows it can hit 28222) but trend maps calling for 3970 in 70 trading days
3) so right NOW at 11:06 PM ET I am going to bed
4) what I am saying is that I cam wake up in 8 hours and bottom maybe in
Note
Note
5) chart above I posted hours ago6) is likely to be way too slow
7) so I am going to bed with price at compression after 2861
8) while it can move for 2822...
9) odds of reversing hard anytime is real
Note
Note
10) I can see the move for 3970 shaping up11) I can also see 2822 floor
12) which means dark blue above is under estimating the turn up
13) so I am trying to to say that if I wake up and it is 2920..
14) that's not a surprise...
15) bc price needs to set up for this rally SOME HOW
Note
16) and I don't have time to evaluate the options we have 17) so be aware what is coming in the future is going to exceed yellow route in chart at top
Note
Note
18) consider chart above so you understand what's in my mind19) I can see that black is coming
20) I understand that blue is unlikely to be the setup for black
21) it should be something like red
22) at the same time the floor is 2822
23) that does not mean we cannot go to 2822
24) in fact a wash out there would be perfect in the next 70 to 80 trading hours
25) or about now to next Wed morning
26) but u need to understand that in this environment
27) A LOT CAN HAPPEN IN 10 HOURS
28) so be aware that bottom CAN BE ANY TIME NOW ...
Note
Note
8.58 AMNote
Still one more bear route to 2745 not eliminated.Note
2745-2770.Note
9:25, after 2846... price should test 2822 or less1) then we will see if bears have a setup for 2745-2760
2) this makes more sense than 4xxx and 5100
Note
Note
02/28/25, 6:02 PM, the chart above has a route to 3380 1) that I will list reasons for why it should be the base case
2) but it has one condition
3) that price must hit 2745-2760 in the coming week
4) because that's the only way to prevent the runaway-top (to 3970+)
Note
Note
1) so in chart above, we ARE AT DECISION POINT FOR 3970 VS 3380 2) with NO OTHER REALISTIC SCENARIO
3) I presented 3380 scenario first because of the following reasons:
Note
- IF price moves to 2745-2760 area, 2955 top makes this run from 2540 total 415 points- which means A COMPLETE TOP for this rally from 2540 is 2955+415+a bit more, or 3370+ (hence I picked 3380)
- of course this range is 3380-3415, that's just spitting hairs
- so 3380-2540 is 840, which completes the second leg of 800+
- the first one is 1985-2790, or 805
- this means that the rally from 1985, or actually from 1975 marker, completes at 3380
- this 3380 also happens to be the $875, Jan 1980 high, which is the adjusted-for-inflation-all-time-high
- that is to say, adjusted for inflation, gold is still lower than it was in 01-20-1980
- there is no legit fundamental reason (says the people that speak about these things) for gold to blow through this
- this total price structure from year 2016 says the 25000 rally has four major tops
- if 3380 is the first top, it fits very well, for example: 3400-6400-12500-25000
- but that's not a great reason
- furthermore, the sideways to up move stalls the 10-20-40-year mean average at 21xx or 22xx
- which in theory SHOULD HIT before the next rally (to 6400)
- if price moves for 3970, it would destroy this mean average structure which causes the violent checkdown
- it would imply that the floor starts at 2580 and higher
- not to mention, we don't even know if 4000 will cap that blow off or not
- and on and on and on..
- but what the charts say???
Note
4) the charts say that next move is bounce to 2885-28955) and bears MUST FORCE THIS TO DROP 150-ISH TO STALL THE MOMENTUM
6) IF they do...
7) THIS WILL IMMEDIATELY BE BOUGHT AND PUSHED ABOVE 2900 AGAIN (within a day or two)
8) that however is enough to stall and change the runaway setup
Note
Note
9) chart above is an example of what happens if bears fail to push down to 2745-276010) because 2822 will not stop this blow off setup
11) THIS WAVE KEEPS RISING because it is less affected by daily prices
12 unless we are talking 200 down from 2955
Note
13) every time I thought we were going sky high since this rally started at 1610...14) I've been wrong
15) so experience and discussions with bond traders tell me that it's going to be 3380 ceiling
16) and 2280 floor end of the year
Note
17) the 3500s, 3666, and 3777 scenarios are no longer realistic18) this wave either breaks through with a bang or it does not
19) if it does, it's not obvious what the top is, 4000 is totally reasonable
Note
20) the next bounce can take 2 days21) which means starting WEDNESDAY bears need to have an answer
22) all it's all over and 3380 COMES IN APRIL
Note
23) base case would be 3970 and we start looking for a route above 400024) that still sound silly to me
25) but we go where price goes
26) we will have an answer by THIS WEDNESDAY OR BEFORE
Note
27) my gut says it's 3380 route28) but price COULD NOT HIT THE WAVE AT 2821 TODAY
29) and also closed above 2855
30) this does not favor bears making it to 2745-2760 zone
Note
8:45 PM, I can't see how bears stop this...Note
Sunday, 03.03.2025, 11.21 PM ET, New York time, so what do I see now?1) stated Friday, bulls would take 2 days to move to 2885-2895
2) well on their way already
3) this means that bulls are favored to break the new down trend line
4) and retest all 2955 by this Thursday with NFP release being this Friday
5) I can't say more meaningfully until Wed for the short term
6) but for the intermediate picture this much can be said with confidence:
Note
a) first, typo on date stamp should be 03.02 not 03.03b) second, 3380 top is a sham
c) no relevant scenario is less than 3510 right now
d) bears can stall and prevent 3970
e) but stopping 3700 is not on the table ...
f) WHETHER OR NOT bears can force 2755 from
g) 3/12 to 3/18 window
h) with FOMC on 3/19
i) meanwhile, base case is no longer 3666, but 3740
j) and this high looking very much like a
MAY HIGH
k) I can't see how it's not a may high..
Note
7) therein lies the problem...8) so trend maps say that all the bears have RIGHT NOW
9) is a long sideways move to 3/20 that...
10) I will comment on Wed if it's more relevant
11) and all that move does, is eliminate highs past 4200
12 ) and make numbers past 3970 hard to entertain
13) long story short, base case is 3740 and ...
14) bears need a good reason to stop the ceiling from rising
Note
15) the current corrective route past this high will be dramatically altered16) will cross that bridge if and when
Note
17) I have more time to deal with these changesNote
Note
Note
18) first chart above is pointing at this week's 2975+ hight19) second chart has arrow pointing at 3000-3030 high BEFORE FOMC
20) so here's the current binary medium term:
Note
A) is chart above, if ceiling DOES NOT BREAK BEFORE FOMC ON 3/19Note
B) if ceiling breaks at that second high, then base case 3970 and we start to look for routes above 4000Note
Note
21) 4:27 PM, 03/03, so in chart above that's the difference 22) between a 3740+++ high (which includes 38xx and 39xx) which is bright yellow
23) and red's runaway rally
24) the decision will come:
Note
Note
25) by the way, small change for this week's high26) it's not obvious bulls can take out 2962
Note
Note
11.07 PM ET, stalling warning in chart above.Note
1) for the record, I am only updating when I can2) but the move up to 3000 seem slower and path not obvious
3) this will eliminate the odds of breaking the ceiling
Note
Note
3.04.25, 8.37 AM ET, so that decision point is here and red route is leading in chart above...1) bears could not stall the direct move to what seemed like 2975 and then 2962
2) bc of this failure, the route to 3000, 3100, and 3200 is now base case
3) by 3.14.25
4) and all routes to 3740 and less now look retarted
Note
5) so base case right now is 3970...6) soles just call it 4000, bc I just don't see why it would stop at 3970...
7) you would be less than 1% away...
Note
8:59 AM ET... What I wanted to write last night was this: a) first, the 8-min BAR chart showed the bulls were stalling
b) and that stalling if continued would lead to a price MISSING THE WINDOW FOR RED ROUTE
c) which I covered 3 days ago in this chart (also up this page):
Note
Note
d) and 4 days ago I also wrote up this page...>>> 21) it should be something like red
>>> 22) at the same time the floor is 2822
>>> 23) that does not mean we cannot go to 2822
>>> 24) in fact a wash out there would be perfect in the next 70 to 80 trading hours
>>> 25) or about now to next Wed morning
>>> 226) but u need to understand that in this environment
>>> 27) A LOT CAN HAPPEN IN 10 HOURS
>>> 28) so be aware that bottom CAN BE ANY TIME NOW ...
Note
e) if you remembered when I wrote this piece, "ENTRY TO 3850 IS BASICALLY NOW" back on January 1st...f) replay here:

Note
g) I opened that with... total long and total convictionh) bc it was obvious we going up
i) so as a "buy and hold entry", you have to take that window
j) but I could not see 4000 getting hit this year
k) well that is now base case unless bears can stop the ceiling from breaking
l) so what I wanted to say last night but did not was
m) if price took the quick route up, price would decide that 3970 (therefore 4000) should be hit this year
n) either May/June or August
o) so unless bears can stop the ceiling from breaking
p) this post is basically dead and we need a new one
Note
q) any way, in post above from January 1st, we did end up hitting both of those first boxesr) BUT DID IT IN THE STRONGEST WAY POSSIBLE
s) that basically means that this bounce off 2832 is basically the same bounce in that chart
t) that comes at the end of May
Note
Note
Note
Note
1) 11:04 AM ET, in chart above...2) this week is NFP
3) if price is really going to "do 4000"
4) we will know by end of Friday
5) if bears intend to win, we need clues by tomorrow night
6) because it gets harder and harder to "force the turn" the higher and faster price moves up
Note
7) what is interesting about blue route is that the hard drop towards 2790 has 2 legs8) the second leg is AFTER FOMC
Note
Note
Note
Note
Note
Note
Note
SO THEN...Note
Note
1) can confidently say blue winning heavily2) but it also looks different
3) odds favor LOW IS IN
4) and FOMC check down to be 2860 or higher
Note
Note
Note
Note
4:56 PM ET, SO THIS POST HAS ENDED, HERE IS SUPER DETAILING FOR 12-MONTHS: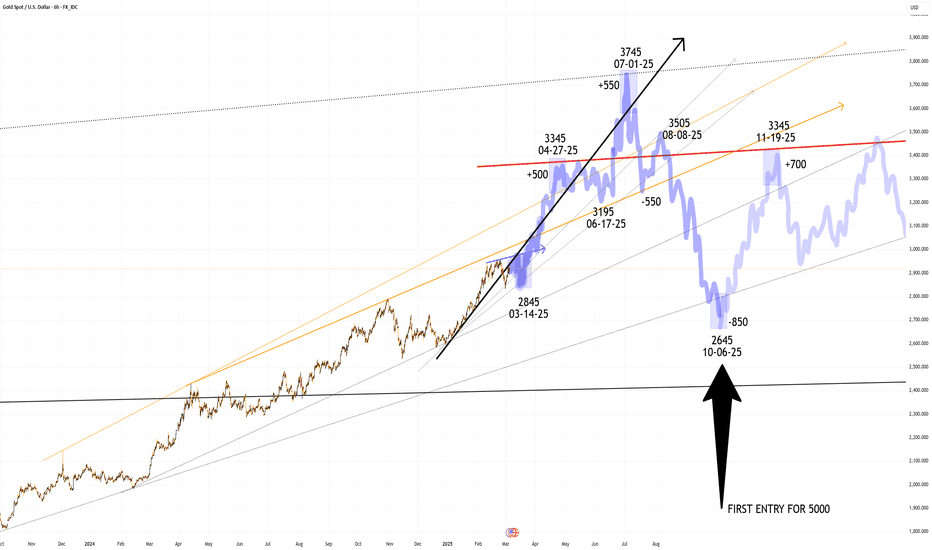
Note
1) chart above is my last public post until this December2) that's how strong the data is
3) from an intermediate basis (meaning one trade every 2 months or less)...
4) that chart is good for 375 days
Related publications
Disclaimer
The information and publications are not meant to be, and do not constitute, financial, investment, trading, or other types of advice or recommendations supplied or endorsed by TradingView. Read more in the Terms of Use.
Related publications
Disclaimer
The information and publications are not meant to be, and do not constitute, financial, investment, trading, or other types of advice or recommendations supplied or endorsed by TradingView. Read more in the Terms of Use.