Looking at your chart:
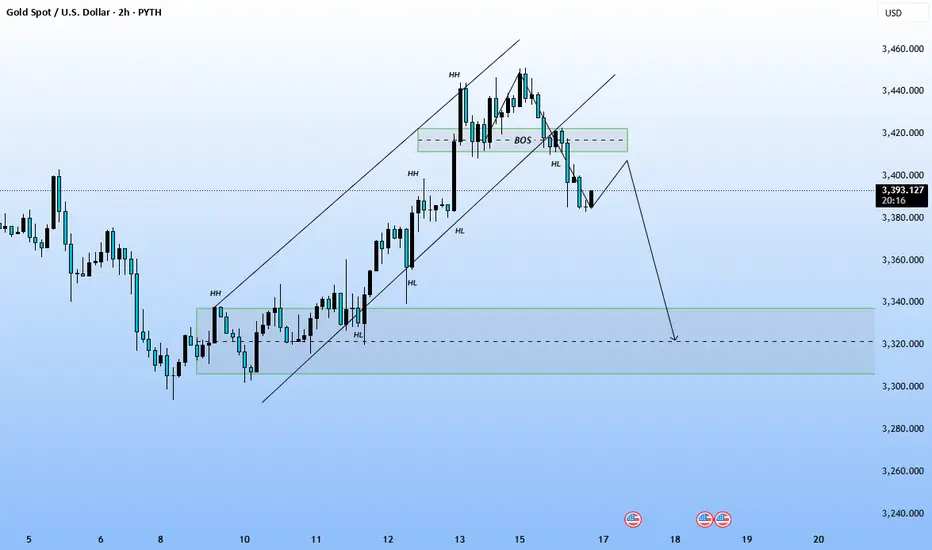
The asset is Gold Spot against the US Dollar (XAU/USD).
The timeframe is 2 hours.
Currently, the price is at $3,390.206.
✅ The price was in an uptrend (with higher highs and higher lows — labeled as “HH” and “HL”).
✅ This uptrend broke structure (BOS — break of structure) after failing to make a new higher high.
✅ Subsequently, a lower high formed, confirming a potential reversal.
✅ The current price action shows a drop after breaking down, with a small retracement upward.
✅ The arrow projected downwards suggests a further drop toward a demand zone or liquidity pool near $3,320.
Overall, the technical view shows a potential reversal from uptrend to downtrend, with a projected move lower following a small upward retracement.
Disclaimer
The information and publications are not meant to be, and do not constitute, financial, investment, trading, or other types of advice or recommendations supplied or endorsed by TradingView. Read more in the Terms of Use.
Disclaimer
The information and publications are not meant to be, and do not constitute, financial, investment, trading, or other types of advice or recommendations supplied or endorsed by TradingView. Read more in the Terms of Use.