7.21 Gold Analysis
Gold continued the trend of last Friday, briefly dropping to $3,345 in the morning before rebounding. Last Thursday, the gold price accurately touched the trend support line of $3,309 and started a V-shaped reversal. On Friday, it reached a high of $3,361, and technical buying continued to exert force.
Analysis of key technical patterns
I. 4-hour chart: Triangle convergence awaiting breakthrough
Trend line game: The gold price has continued to fluctuate in the range of $3,309-3,380 in the past two weeks, forming an obvious ascending triangle structure:
Bottom support line: Strong buying support was obtained in the 3,300-3,310 area for three consecutive times (including the low of 3,309 last Thursday), and the rebound range expanded each time.
Top suppression line: The previous two rebounds were blocked and fell below 3,380. The current price has not yet touched this resistance, and we need to be alert to the risk of history repeating itself.
Prediction of the breakthrough direction:
If it successfully breaks through $3380, it will open up the space of 3400-3420;
If it loses $3330, it may fall back to the 3300-3280 area.
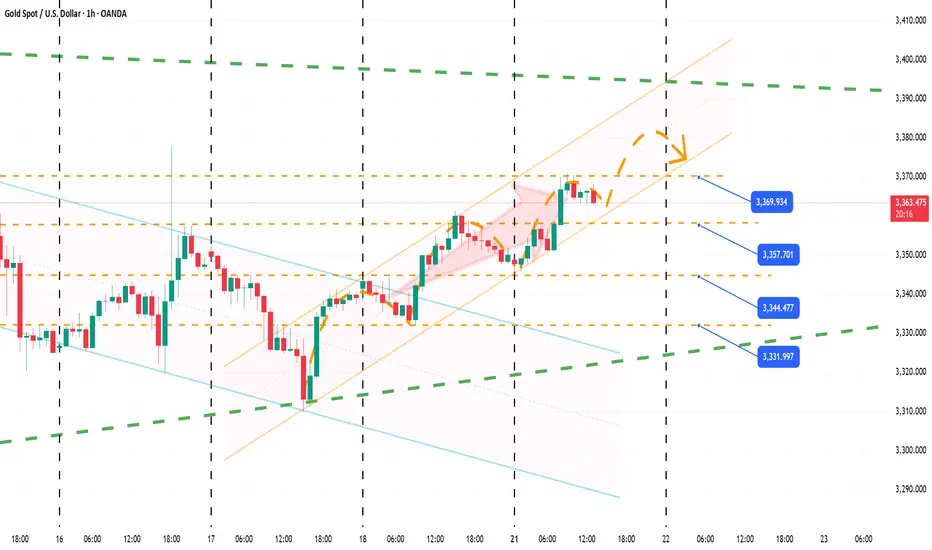
2. 1-hour chart: critical point of the five-wave rising structure
Wave theory signal:
Currently in the fourth wave retracement stage, the early low of $3345 is exactly the top of the first wave, which meets the bullish condition of "four waves do not break the top of one wave".
If the pattern is established, the fifth wave of rise may push the gold price to hit the target area of 3375-3380.
Bull and bear life and death line: $3340
Hold above this position → maintain the bullish structure and wait for the opportunity to arrange long orders;
If the entity falls below → the wave pattern is destroyed, it is necessary to turn to a short strategy.
3. Trading logic
Long strategy:
Entry area: 3345-3350, stop loss is strictly set below 3338;
Target level: First target 3370 → Look to 3375-3380 (trend line suppression area) after breakthrough.
Short strategy: 3360/3370/3380, you can enter the market with a light position at each top, stop loss 3400. Target 3345/3330
If my analysis can help you, I hope you can give me a thumbs up.
Gold continued the trend of last Friday, briefly dropping to $3,345 in the morning before rebounding. Last Thursday, the gold price accurately touched the trend support line of $3,309 and started a V-shaped reversal. On Friday, it reached a high of $3,361, and technical buying continued to exert force.
Analysis of key technical patterns
I. 4-hour chart: Triangle convergence awaiting breakthrough
Trend line game: The gold price has continued to fluctuate in the range of $3,309-3,380 in the past two weeks, forming an obvious ascending triangle structure:
Bottom support line: Strong buying support was obtained in the 3,300-3,310 area for three consecutive times (including the low of 3,309 last Thursday), and the rebound range expanded each time.
Top suppression line: The previous two rebounds were blocked and fell below 3,380. The current price has not yet touched this resistance, and we need to be alert to the risk of history repeating itself.
Prediction of the breakthrough direction:
If it successfully breaks through $3380, it will open up the space of 3400-3420;
If it loses $3330, it may fall back to the 3300-3280 area.
2. 1-hour chart: critical point of the five-wave rising structure
Wave theory signal:
Currently in the fourth wave retracement stage, the early low of $3345 is exactly the top of the first wave, which meets the bullish condition of "four waves do not break the top of one wave".
If the pattern is established, the fifth wave of rise may push the gold price to hit the target area of 3375-3380.
Bull and bear life and death line: $3340
Hold above this position → maintain the bullish structure and wait for the opportunity to arrange long orders;
If the entity falls below → the wave pattern is destroyed, it is necessary to turn to a short strategy.
3. Trading logic
Long strategy:
Entry area: 3345-3350, stop loss is strictly set below 3338;
Target level: First target 3370 → Look to 3375-3380 (trend line suppression area) after breakthrough.
Short strategy: 3360/3370/3380, you can enter the market with a light position at each top, stop loss 3400. Target 3345/3330
If my analysis can help you, I hope you can give me a thumbs up.
❤️I am a trading researcher focusing on the gold field.
❤️If you are looking for direction, welcome to follow me.
👉t.me/+CW0VWaiEB59hMmJh
❤️If you are looking for direction, welcome to follow me.
👉t.me/+CW0VWaiEB59hMmJh
Disclaimer
The information and publications are not meant to be, and do not constitute, financial, investment, trading, or other types of advice or recommendations supplied or endorsed by TradingView. Read more in the Terms of Use.