Chart Details & Elements:
Instrument & Timeframe:
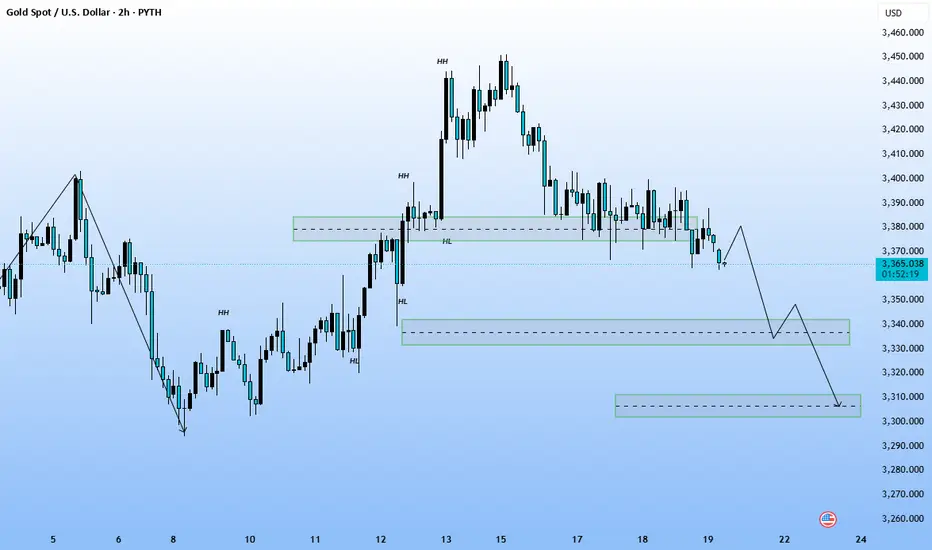
Asset: XAU/USD (Gold Spot vs U.S. Dollar)
Timeframe: 2-hour chart (each candlestick = 2 hours)
Price Labels (Structure):
The chart is marked with key market structure points:
HH: Higher High
HL: Higher Low
These identify the previous uptrend.
But recently, the structure shows lower highs forming, indicating a shift in trend direction.
Current Price:
~3365.60 USD/oz, hovering slightly above the projected breakdown zone.
Zones Highlighted:
First Gray Box (~3350–3370): A supply or support-turned-resistance zone where price is currently reacting.
Second Gray Box (~3325–3340): A demand zone where a temporary bounce is expected.
Third Gray Box (~3300–3310): A deeper demand zone, likely a final target for a bearish move.
Forecasted Path (Gray Zigzag Line):
Bearish Outlook:
A slight upward move (possibly a retest or lower high).
Followed by a drop to the mid-level zone (~3330s).
Then another consolidation or minor retracement.
Finally, a further drop to the 3300 area.
Interpretation:
The chart suggests a reversal from bullish to bearish structure.
Lower highs and a shift in momentum support a bearish sentiment.
If price breaks the near-term structure cleanly, a move to the 3310–3300 zone is anticipated.
The use of structure labels (HH/HL) helps confirm the market’s transition.
Instrument & Timeframe:
Asset: XAU/USD (Gold Spot vs U.S. Dollar)
Timeframe: 2-hour chart (each candlestick = 2 hours)
Price Labels (Structure):
The chart is marked with key market structure points:
HH: Higher High
HL: Higher Low
These identify the previous uptrend.
But recently, the structure shows lower highs forming, indicating a shift in trend direction.
Current Price:
~3365.60 USD/oz, hovering slightly above the projected breakdown zone.
Zones Highlighted:
First Gray Box (~3350–3370): A supply or support-turned-resistance zone where price is currently reacting.
Second Gray Box (~3325–3340): A demand zone where a temporary bounce is expected.
Third Gray Box (~3300–3310): A deeper demand zone, likely a final target for a bearish move.
Forecasted Path (Gray Zigzag Line):
Bearish Outlook:
A slight upward move (possibly a retest or lower high).
Followed by a drop to the mid-level zone (~3330s).
Then another consolidation or minor retracement.
Finally, a further drop to the 3300 area.
Interpretation:
The chart suggests a reversal from bullish to bearish structure.
Lower highs and a shift in momentum support a bearish sentiment.
If price breaks the near-term structure cleanly, a move to the 3310–3300 zone is anticipated.
The use of structure labels (HH/HL) helps confirm the market’s transition.
Disclaimer
The information and publications are not meant to be, and do not constitute, financial, investment, trading, or other types of advice or recommendations supplied or endorsed by TradingView. Read more in the Terms of Use.
Disclaimer
The information and publications are not meant to be, and do not constitute, financial, investment, trading, or other types of advice or recommendations supplied or endorsed by TradingView. Read more in the Terms of Use.