1. Brief analysis of gold fundamentals
The current gold price is fluctuating downward, and the core driving factors are:
Risk aversion has cooled down:
The United States and Japan reached an agreement on automobile tariffs and promoted an agreement with the European Union, easing previous global trade tensions;
The overall risk appetite of the market has increased, and safe-haven funds have withdrawn from gold.
The US dollar rebounded in stages:
The US dollar index rebounded after the previous decline, which partially offset the safe-haven appeal of gold;
Although there are expectations of interest rate cuts within the Federal Reserve, there are large differences, and the overall trend is still "wait-and-see", which has increased the volatility of the US dollar trend.
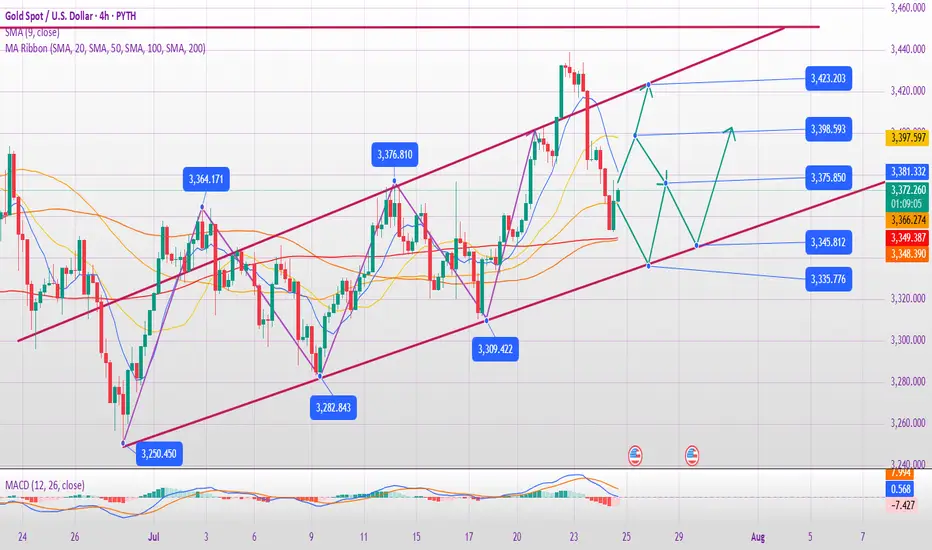
2. Technical analysis of gold
Trend characteristics:
Gold has fallen from the high of 3438 and has been under pressure for two consecutive days;
It is currently testing the 0.618 retracement support (about 3360) of the 3310-3438 increase;
The European session continued to fall. If there is a rebound before the US session, there may be a risk of "false breakthrough and real decline";
If the US session still does not rise in the early session, it is necessary to pay attention to the possible V-shaped reversal in the future.
Technical indicators:
The short-term MACD bottom divergence gradually emerges, and the probability of oversold rebound correction increases;
Important support: 3350-3340 range (once lost, it may test the lower track of the 3337 daily triangle);
Key pressure: 3393-3403 range (initial rebound resistance), stronger resistance is around 3416-3418.
III. Short-term operation strategy suggestions
✅ Main idea: shorting on rebound is the main, and long on callback is the auxiliary
Short order layout reference:
If the 3393-3403 area encounters resistance, you can try to short with a light position;
Stop loss is set above 3410, and the target is 3360-3350;
If the market breaks through 3403 strongly and stabilizes, the short order strategy needs to be suspended.
Long position layout reference:
If it drops to 3350-3340 and stabilizes, you can try short-term long with a light position;
Stop loss is set below 3335, and the target is 3375-3385;
If the market quickly breaks below 3337, wait for the lower support to stabilize before intervening.
IV. Trend warning points
If the price does not rebound significantly before the early US market, it is necessary to guard against a sudden V-shaped pull after the US market;
If it directly falls below 3340, the space below opens, it is recommended to stop loss in time and wait for new support points.
✅ Conclusion:
In the short term, gold is still in the downward correction stage, but as the technical oversold signs appear, short-term sharp pull rebound should be guarded against. It is recommended to respond flexibly in operation, pay attention to the response of key support and resistance levels, and avoid chasing up and selling down.
Trade active
Analysis strategy for the latest trend of gold:
Current market key points
Daily level
Structure: Gold price fell after hitting 3373, and the daily K-line closed negative, indicating that the bulls were weak.
Indicators:
MACD: Golden cross but the rising momentum column shortened → the rising momentum weakened.
KDJ: Dead cross downward → short-term bearish signal.
Key position:
Resistance: 3375 (previous high + top and bottom conversion position).
Support: 3330-3325 (if broken, it may fall further).
4-hour level
Trend: MA5-MA10 dead cross, Bollinger band lower rail opening → short-term dominant.
MACD: Dead cross downward momentum column enlarged → downward momentum strengthened.
KDJ: Oversold but not turning → Be wary of short-term rebound, but the trend is still bearish.
1-hour level
Moving averages are arranged in a bearish position, and the indicator dead crosses → there is still room for short-term decline.
Operation suggestions
1. Main strategy: short on rebound
Entry range: 3360-3363 (if the rebound is under pressure).
Stop loss: above 3370 (to prevent a breakthrough of 3375 and turn strong).
Target: 3350 (short-term) → 3340-3330 (if the decline continues).
2. Alternative strategy (if the trend changes)
If it breaks through 3375: stop loss on short orders and wait and see whether it turns to long.
If it stabilizes at 3340-3330: short-term rebound is possible, but it needs to cooperate with K-line signals.
Risk warning
Oversold rebound risk: KDJ enters the oversold zone. If the market sentiment reverses (such as sudden news stimulation), it may rebound in the short term.
Key support 3330: If it breaks down, it may open up a larger downward space; if it holds, it may fluctuate and consolidate.
It is recommended to strictly implement stop loss and flexibly respond to changes in the market.
❤️Free gold trading signals:t.me/+OJSbWQ6F4KM2Mzk1
💥Gold trading analyst | Technology + logic dual drive
💯Intraday/band strategy analysis | Risk control first, win in stability
💥Gold trading analyst | Technology + logic dual drive
💯Intraday/band strategy analysis | Risk control first, win in stability
Related publications
Disclaimer
The information and publications are not meant to be, and do not constitute, financial, investment, trading, or other types of advice or recommendations supplied or endorsed by TradingView. Read more in the Terms of Use.