XAUUSD 2-hour chart I provided, here’s a breakdown of the current setup and potential buy scenario:
🔍 Chart Summary:
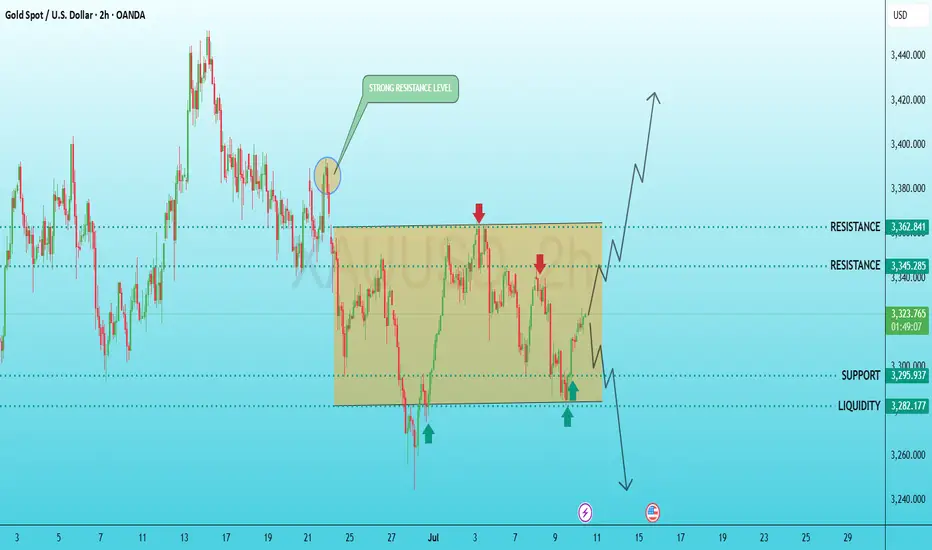
Current Price: Around 3322
Range-Bound Structure: The price is consolidating within a rectangle range, between ~3296 (support) and ~3345 (resistance).
Strong Resistance Zone: Marked around 3362–3370
Liquidity Zone: Near 3282
Buy Reactions: Two green arrows indicate bullish reactions from the lower boundary of the range, signaling potential accumulation.
✅ Buy Setup Plan:
Entry:
Buy Entry Zone: 3295–3305
(Just above the support and liquidity zone)
Stop Loss (SL):
Below liquidity sweep:
SL: 3275
Take Profits (TPs):
TP1: 3345 (Upper range resistance)
TP2: 3362 (Strong resistance)
TP3 (Aggressive): 3400+
📈 Trade Idea Summary:
The price is holding the lower range with signs of reversal.
A buy near support with a tight SL offers a favorable risk-reward.
Watch for volume increase or bullish candlestick patterns (e.g., bullish engulfing) near support to confirm entry.
🔍 Chart Summary:
Current Price: Around 3322
Range-Bound Structure: The price is consolidating within a rectangle range, between ~3296 (support) and ~3345 (resistance).
Strong Resistance Zone: Marked around 3362–3370
Liquidity Zone: Near 3282
Buy Reactions: Two green arrows indicate bullish reactions from the lower boundary of the range, signaling potential accumulation.
✅ Buy Setup Plan:
Entry:
Buy Entry Zone: 3295–3305
(Just above the support and liquidity zone)
Stop Loss (SL):
Below liquidity sweep:
SL: 3275
Take Profits (TPs):
TP1: 3345 (Upper range resistance)
TP2: 3362 (Strong resistance)
TP3 (Aggressive): 3400+
📈 Trade Idea Summary:
The price is holding the lower range with signs of reversal.
A buy near support with a tight SL offers a favorable risk-reward.
Watch for volume increase or bullish candlestick patterns (e.g., bullish engulfing) near support to confirm entry.
JOIN MY TELEGRAM:
FREE SIGNALS TECHNICAL CHART AND EDUCATOIN
t.me/+j_sv6p9sL5I0MDY0
FREE SIGNALS TECHNICAL CHART AND EDUCATOIN
t.me/+j_sv6p9sL5I0MDY0
Disclaimer
The information and publications are not meant to be, and do not constitute, financial, investment, trading, or other types of advice or recommendations supplied or endorsed by TradingView. Read more in the Terms of Use.