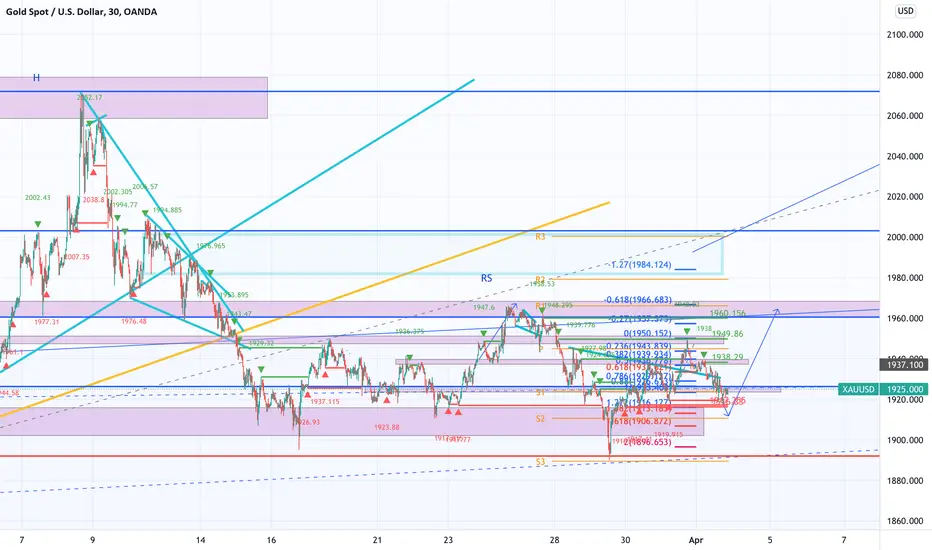
I am long this week on Gold, because I see a couple confirmations.
Elliot wave analysis: The correction that we have at the moment retraced to 61.8% Fibonacci level of the previous Impuls move, which is enough. Normally the correction should close the gap and test the previous consolidation, which in this case is the big triangle, but it not necessary. If the price can not close this gap, means that the trend is very strong and the price will return later to close it.
Chart patterns: Right now the price is forming a sideways move, which have 2 patterns inside - Head and Shoulders and Double bottom. Normally if there is 2 reversal patterns are inside of consolidation in the middle of the trend, this is a continuation pattern. The market rejected very strong the the 1890-1895 levels.
Candlestick analysis: If you watch the whole consolidation at daily Timeframe, you can see that there are more bullish candles than bearish. You are able to see that there are more consecutive bullish candles than bearish. This means that the structure have bullish momentum.
Volume analysis: If you observe the volume, you see that there is no volume to the downside.
Market: The slope of the whole down move from 2070 is not comparable with the slope of the previous up move. The slope and lack of volume make me thing, that the this is only a correction, before big move up. Monthly structure is bullish and monthly candle is the second bullish candle, although the big wick.
Indicators: Bullish move is supported from 50 EMA, 200 EMA, RSI and Ichimoku cloud.
Fundamentals support the bullish continuation too.
Of course there is a possibility to drop to the 1850, testing the triangle, before the big bullish move.
Disclaimer
The information and publications are not meant to be, and do not constitute, financial, investment, trading, or other types of advice or recommendations supplied or endorsed by TradingView. Read more in the Terms of Use.
Disclaimer
The information and publications are not meant to be, and do not constitute, financial, investment, trading, or other types of advice or recommendations supplied or endorsed by TradingView. Read more in the Terms of Use.