At FuInvest, we analyze the market from three essential perspectives: technical analysis, fundamental analysis, and market psychology to provide a comprehensive view of gold’s price action and the best trading strategies moving forward.
1️⃣ Fundamental Analysis: Macro Trends Driving Gold Prices
Gold's recent price movements have been heavily influenced by economic and geopolitical factors:
U.S. Interest Rates & Federal Reserve Policy 🏦📉
The Fed’s monetary policy remains a key driver of gold prices. While inflation has shown signs of cooling, recent hawkish statements from the Fed suggest interest rates may remain elevated longer than expected. Higher rates generally weaken gold, as they increase the opportunity cost of holding a non-yielding asset.
Global Economic Uncertainty & Recession Fears 📉🌍
Concerns over slowing economic growth in China and the Eurozone have increased demand for safe-haven assets like gold. However, a strengthening U.S. dollar has partially offset gold’s upside potential.
Geopolitical Risks & Market Sentiment 🔥⚠️
Ongoing geopolitical tensions in Eastern Europe and the Middle East have led to periodic spikes in gold prices. However, without a major escalation, the market seems to be focusing more on macroeconomic trends.
2️⃣ Technical Analysis: Decoding the Price Action
Daily Chart (D1) – Long-Term Trend Outlook 📊
🔹 Trend: The long-term trend remains bullish, but the recent drop signals a potential shift in momentum.
🔹 Key Support: $2,800 – A critical psychological and technical support zone.
🔹 Key Resistance: $2,900 – A break above this could signal a continuation of the uptrend.
🔹 RSI: Currently at 49.68, indicating a neutral position but approaching oversold territory.
🔹 MACD: Shows a bearish crossover, suggesting short-term downside pressure.
📌 Verdict: The broader trend is still intact, but a deeper pullback toward the $2,800 support level is possible before the next bullish move.
4-Hour Chart (H4) – Medium-Term Perspective 📉
🔹 Recent Price Action: Gold has seen a steady decline but found temporary support around $2,832.
🔹 Volume Analysis: Increased selling volume indicates strong bearish pressure, but signs of buyer accumulation are emerging.
🔹 RSI: 31.22, entering oversold territory, suggesting a potential reversal soon.
🔹 MACD: Strongly bearish but showing signs of divergence, hinting at an upcoming bounce.
📌 Verdict: A short-term rebound is likely, but sustained upside movement requires confirmation above $2,875.
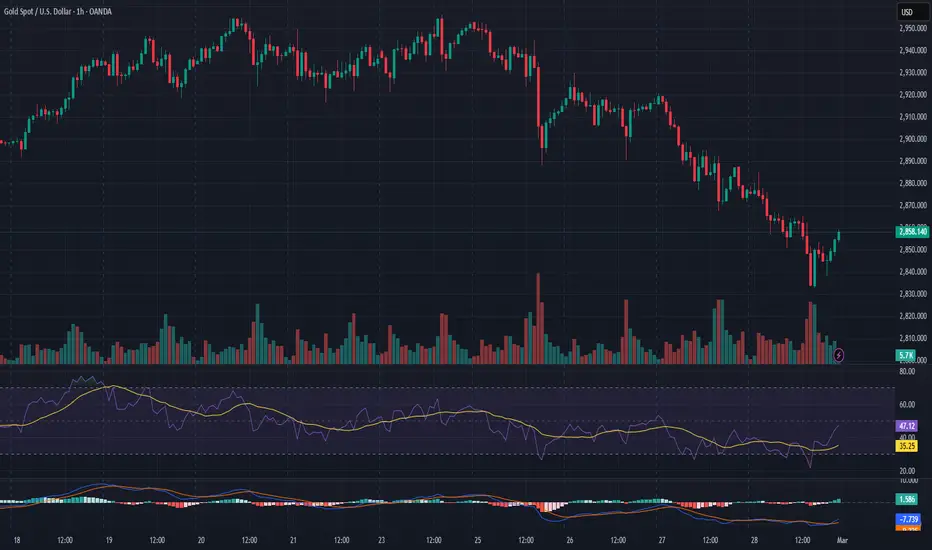
1-Hour Chart (H1) – Short-Term Trading Setup ⚡
🔹 Current Price: $2,858
🔹 Immediate Resistance: $2,875 – Short-term traders should watch for a breakout.
🔹 Immediate Support: $2,840 – If broken, expect further declines toward $2,810.
🔹 RSI: 35.25, showing short-term oversold conditions.
🔹 MACD: Weak bearish momentum, indicating potential consolidation before the next move.
📌 Verdict: Short-term traders can look for buying opportunities near $2,840 with a stop loss below $2,820.
3️⃣ Market Psychology: How Traders Are Reacting 🤯
Fear & Greed Index: Traders are exhibiting fear, as reflected in gold’s recent sell-off. Historically, such moments create buying opportunities for smart investors.
Retail vs. Institutional Sentiment: Retail traders are panicking, while institutional investors are accumulating gold near strong support levels.
Liquidity Zones: High trading volumes near $2,850–$2,860 suggest this area will be a battleground for bulls and bears.
🎯 FuInvest Trading Strategy & Recommendations
Based on our multi-faceted analysis, here’s the optimal trading plan:
📌 Scenario 1: Buying the Dip (Recommended Strategy)
Entry: Buy near $2,840–$2,850
Stop Loss: Below $2,820 (to avoid deeper declines)
Take Profit: $2,875–$2,900
Risk-Reward Ratio: 1:3 (highly favorable setup)
📌 Scenario 2: Short-Term Sell (If Breakdown Occurs)
Entry: Sell if price breaks below $2,840
Stop Loss: Above $2,860
Take Profit: $2,810–$2,800
Risk-Reward Ratio: 1:2
Conclusion: What’s Next for Gold? 🔥
✅ The long-term bullish trend remains intact, but short-term corrections are creating volatility.
✅ A potential rebound from support at $2,840–$2,850 is likely, offering a buying opportunity.
✅ A break below $2,840 could lead to further downside pressure toward $2,800.
✅ Institutional investors are eyeing key levels for accumulation, signaling possible upside momentum soon.
📣 Stay tuned to FuInvest for daily updates and strategic insights to stay ahead of the market! 🚀📊
Disclaimer
The information and publications are not meant to be, and do not constitute, financial, investment, trading, or other types of advice or recommendations supplied or endorsed by TradingView. Read more in the Terms of Use.
Disclaimer
The information and publications are not meant to be, and do not constitute, financial, investment, trading, or other types of advice or recommendations supplied or endorsed by TradingView. Read more in the Terms of Use.