
Bitcoin (BTCUSD) is showing us quite the mixed signals on the weekly time frame when we compare BitFinex to other exchanges, here I am looking at it vs BitMEX, but this also applies to CoinBase, BitStamp, and others.
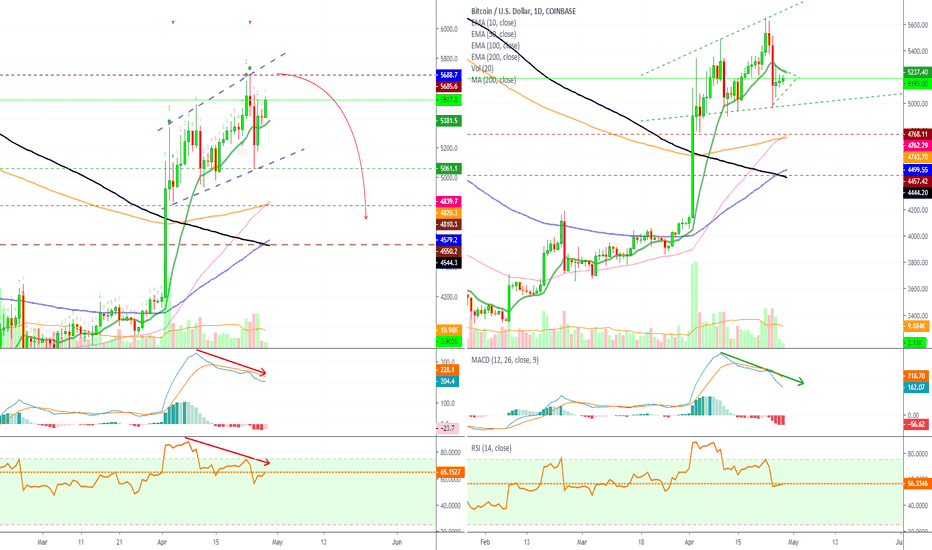
On the left side, we have the BitFinex chart, which is really bullish right now with BTCUSD trading above EMA50 and EMA100 within an ascending channel.
The MaCD and RSI are also pretty solid here and clearly leaning towards the bulls. Trading volume this week is above average.
On the right side, we have the BitMEX chart, which is leaning more towards the bears. Bitcoin (XBTUSD) is trading below EMA50 and EMA100 with increasing bear volume.
The MACD is slightly curving, while the RSI peaked last weak and is showing bearish divergence. Trading volume is also high here compared to average.
Can BitFinex break to the upside while other exchanges break to the downside, is this possible?
I highly believe that this price difference is starting to become way too big and it is only going to translate into 'trouble' pretty soon... Here you can read the full details about this situation:
And here:
What's your take on this huge price spread between BitFinex and other exchanges? Will this really produce a pump or a dump?
Please share your thoughts in the comments section below.
Thanks a lot for reading.
Namaste.
🚨 TOP FREE Trades
ETH +1450% · AAVE +1134%
XRP +749% · DOGS +868%
BTC +563% · SOL +658%
t.me/anandatrades/1350
🚨 FREE Analyses & New Results
t.me/masteranandatrades/6499
🚨 PREMIUM LIFETIME (Since 2017)
lamatrades.com
ETH +1450% · AAVE +1134%
XRP +749% · DOGS +868%
BTC +563% · SOL +658%
t.me/anandatrades/1350
🚨 FREE Analyses & New Results
t.me/masteranandatrades/6499
🚨 PREMIUM LIFETIME (Since 2017)
lamatrades.com
Related publications
Disclaimer
The information and publications are not meant to be, and do not constitute, financial, investment, trading, or other types of advice or recommendations supplied or endorsed by TradingView. Read more in the Terms of Use.