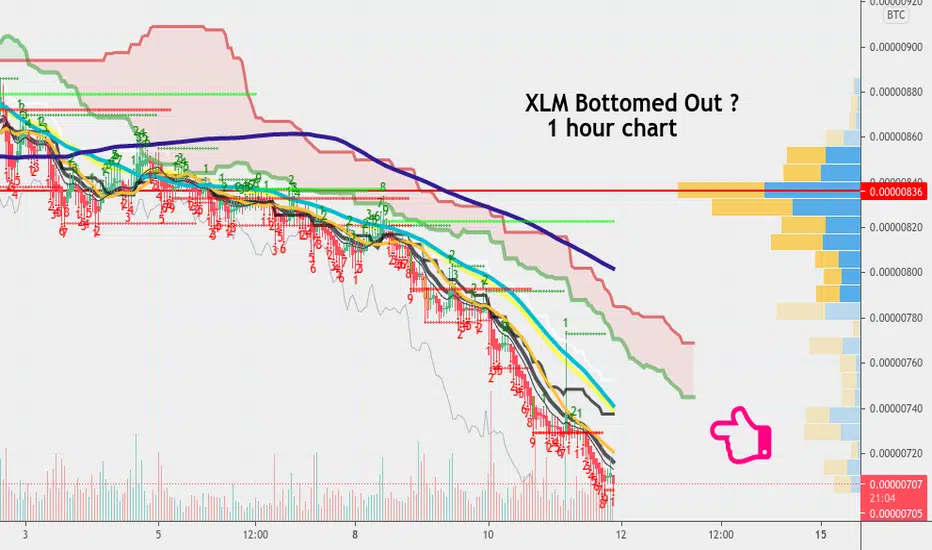
Here we see our XLM Btc 1 hour chart on Binance . As you see we have dipped way down here into the 700 area. We have hit another TD Sequential 9 in red here and should really see a turnaround come soon . I'd wait for confirmation but a target above us seems to be 836 - which would be that red line above us. That's part of our VPVR indicator and the red line is an area of confluence and should be a target above us where we will be going at some point. I still think there is a large Cup and Handle structure forming on this XLM chart on the higher timeframes but here we see the chart is bottomed out . When this finally turns up the targets above should be our fibs which are =
1926 - that's our .236 fib
2862 - that's our .382 fib
3619 - that's our .5 fib
4375 - that's our .618 fib
4939 - that's our .786 fib
there may be a pullback somewhere near 37xx since that could be the lip of the cup - but Xlm can see returns to All Time Highs this year . Thank you.
1926 - that's our .236 fib
2862 - that's our .382 fib
3619 - that's our .5 fib
4375 - that's our .618 fib
4939 - that's our .786 fib
there may be a pullback somewhere near 37xx since that could be the lip of the cup - but Xlm can see returns to All Time Highs this year . Thank you.
😃 Join shimmeringpath's friendly free
Telegram chat here : bulls and bears both welcome !
t.me/CryptoRisingTradersChat
Telegram chat here : bulls and bears both welcome !
t.me/CryptoRisingTradersChat
Related publications
Disclaimer
The information and publications are not meant to be, and do not constitute, financial, investment, trading, or other types of advice or recommendations supplied or endorsed by TradingView. Read more in the Terms of Use.