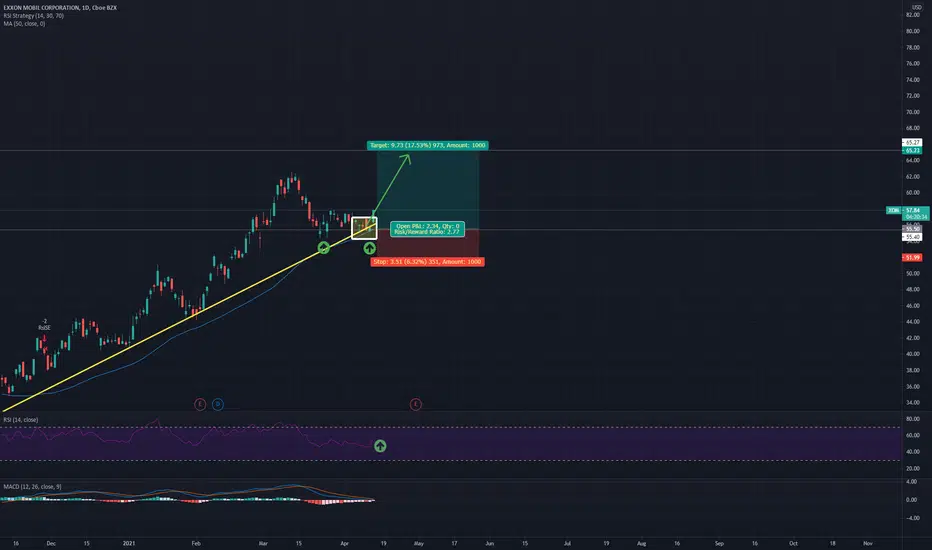
XOM is bouncing off the yellow support line and is heading to its 52 weeks high before its earnings on April 31st. All indicators are in favor of this bullish movement. You see a double bottom on the chart, and RSI which is rising, and the MACD that is about to cross up. Don't forget to check out the stop loss and make sure to set it as soon as you placed your trade. Nothing is guaranteed in this giant casino!
Anyways, this is a ~2:1 risk ratio trade and has a high chance of successful execution.
Anyways, this is a ~2:1 risk ratio trade and has a high chance of successful execution.
Note
Party begins!Note
Still going...Trade closed: target reached
Market Maven: Never Miss a Move.
Disclaimer: This is not a financial advice and all posts are for educational purposes only.
Disclaimer: This is not a financial advice and all posts are for educational purposes only.
Disclaimer
The information and publications are not meant to be, and do not constitute, financial, investment, trading, or other types of advice or recommendations supplied or endorsed by TradingView. Read more in the Terms of Use.