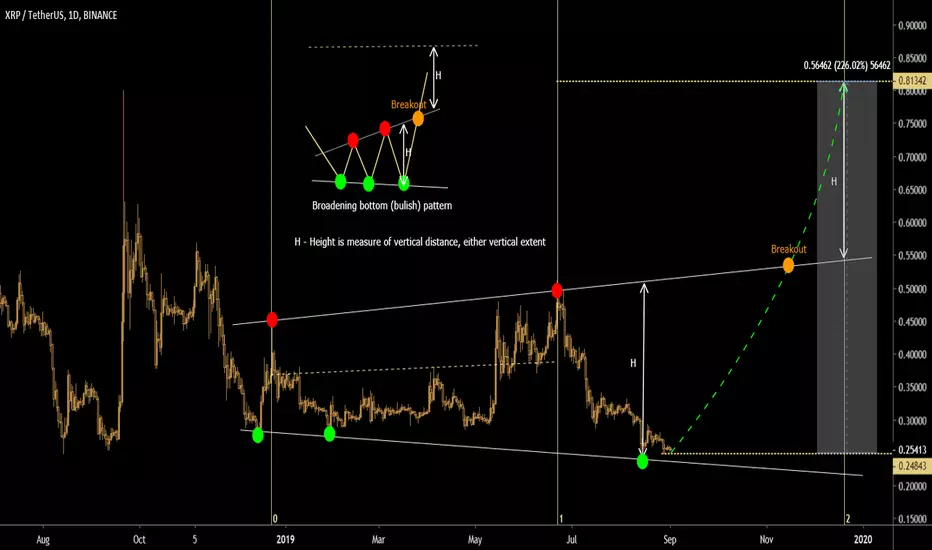
Hello! In 2019, investors were hoping for big profits from Riple as we all expected Ripple to announce big bank deals, thus expecting it to explode.But alas, things didn't work out that way. Today, we'll look at Ripple (XRP) broadening bottom (bulish pattern) .This pattern shows us where we are right now (perhaps the best option to buy) and where the next peak will be after the breakout. All this is possible only with the breakout. If you are wondering what it means the white line is denoted by H - this is the height of the lowest measure to the highest point of the pattern.After a possible breakout the pattern indicates that we will reach the same value in peak.Remember that we can not predict the date when it will happen to 100% but the Fibonacci time zone indicator shows us approximately! Good luck to you all!
Every investment and every trade is a risk, so you should always do your own research before making any decisions. We do not recommend investing money that you cannot afford to lose.
Every investment and every trade is a risk, so you should always do your own research before making any decisions. We do not recommend investing money that you cannot afford to lose.
Disclaimer
The information and publications are not meant to be, and do not constitute, financial, investment, trading, or other types of advice or recommendations supplied or endorsed by TradingView. Read more in the Terms of Use.
Disclaimer
The information and publications are not meant to be, and do not constitute, financial, investment, trading, or other types of advice or recommendations supplied or endorsed by TradingView. Read more in the Terms of Use.