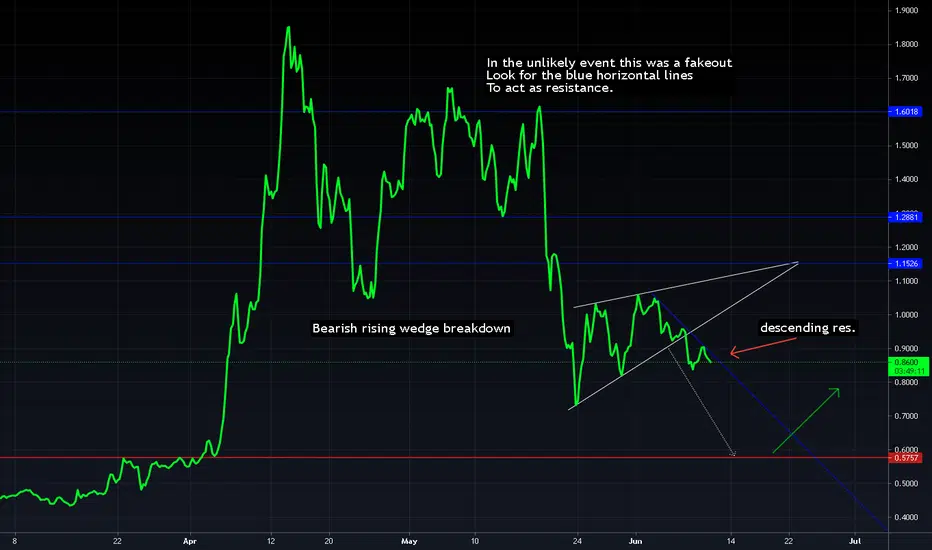
Fairly basic look at XRP on line-chart 6hr using the (O+H+L+C)/4 setting to display PA
I'd be expecting a test of the lower breakout region in the upper .5's before XRP makes a bullish recovery to continue it's macro uptrend.
In the event XRP spontaneously recovers, I've included some resistance levels for tp points
I had my eyes on this chart for quite some time & have finally decided that it's likely to play out in the bears favor:

Note
Gold vs XRP is extremely bearish atm & looking like XRP is set to make a major move up against gold:Silver vs XRP very bearish for silver, looking like XRP is ready to make some major gains against it!!
Note
tradingview.com/x/ADvWIXex.pnglook familiar?
Note
Here was an earlier chart demonstrating a similar Idea
Related publications
Disclaimer
The information and publications are not meant to be, and do not constitute, financial, investment, trading, or other types of advice or recommendations supplied or endorsed by TradingView. Read more in the Terms of Use.
Related publications
Disclaimer
The information and publications are not meant to be, and do not constitute, financial, investment, trading, or other types of advice or recommendations supplied or endorsed by TradingView. Read more in the Terms of Use.