Looking at the 3 month chart of Dow Jones, with a little under 2 months to go until the close of the current 3 month bar, I believe it will close near the highs. The last 3 month bar was a reverse hammer, a very bullish candle and a buy signal.

This current week's candle gave me a huge clue as to what will most likely happen next. It is creating a gap spacing between multiple candles to get engulfed by a huge bull candle.


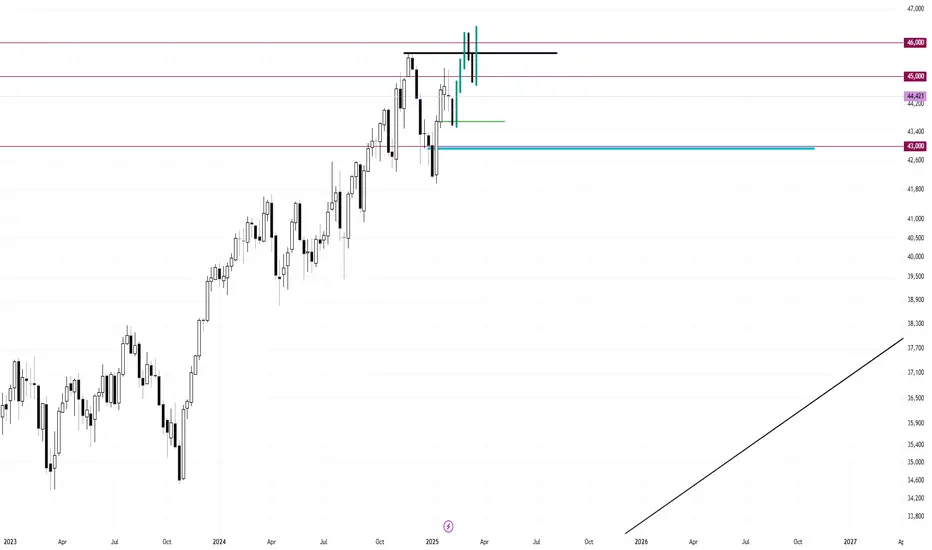
On the Daily chart

The 8 Hour chart is flagging in a bullish consolidation building up right under the break of the highs for 46,000

This current week's candle gave me a huge clue as to what will most likely happen next. It is creating a gap spacing between multiple candles to get engulfed by a huge bull candle.
On the Daily chart
The 8 Hour chart is flagging in a bullish consolidation building up right under the break of the highs for 46,000
Note
Focus on avoiding the middle of the range and getting dragged higher of lower into the middle. Sell at the top and buy at the bottom. Disclaimer
The information and publications are not meant to be, and do not constitute, financial, investment, trading, or other types of advice or recommendations supplied or endorsed by TradingView. Read more in the Terms of Use.
Disclaimer
The information and publications are not meant to be, and do not constitute, financial, investment, trading, or other types of advice or recommendations supplied or endorsed by TradingView. Read more in the Terms of Use.