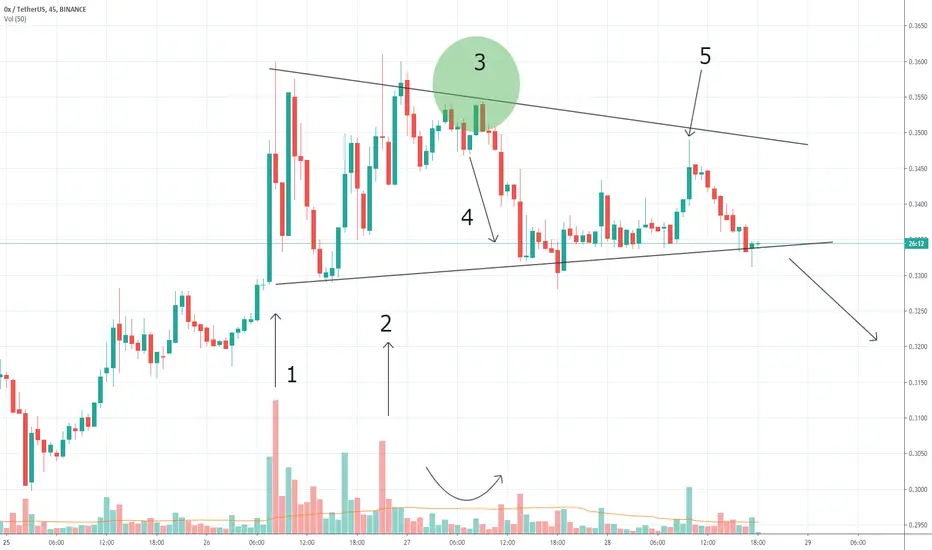
Zrx looks very weak on this 45m chart.
You see 1-2 bars with the maximum volume, I highlighted them with two arrows, they have a maximum above the level of 0.35. However, these extremely high volumes on attempts to rise can mean hidden weakness.
Most likely, hidden professional selling occurred around 0.35 because at point 3 there is trading on very small volumes near the resistance level. This means a weak market and a lack of demand.
Arrow number 4 indicates a surge in volumes amid falling prices - a typical occurrence for selling pressure. Sellers come out of the shadows.
A burst of activity on arrow number 5 indicates a bull trap. This is a fraudulent movement that often occurs on the eve of decline.
Thus, we can most likely say that the chart tells us a bearish story. Several attempts to establish a bullish trend were not successful, therefore, a bearish breakdown of the triangle in this situation looks like the most logical development.
Check my taplink.cc/chartreadingpro
Disclaimer
The information and publications are not meant to be, and do not constitute, financial, investment, trading, or other types of advice or recommendations supplied or endorsed by TradingView. Read more in the Terms of Use.
Check my taplink.cc/chartreadingpro
Disclaimer
The information and publications are not meant to be, and do not constitute, financial, investment, trading, or other types of advice or recommendations supplied or endorsed by TradingView. Read more in the Terms of Use.