Weather and Corn: Understanding the Precipitation Factor1. Introduction: Rain, Grain, and Market Chain Reactions
In the world of agricultural commodities, few forces carry as much weight as weather — and when it comes to corn, precipitation is paramount. Unlike temperature, which can have nuanced and sometimes ambiguous effects depending on the growth stage, rainfall exerts a more direct and consistent influence on crop performance. For traders, understanding the role of rainfall in shaping market sentiment and price behavior isn't just an agricultural curiosity — it's a trading edge.
This article unpacks the relationship between weekly rainfall levels and corn futures prices. By leveraging normalized weather data and historical returns from Corn Futures (ZC), we aim to translate weather signals into actionable market insights. Whether you're managing large agricultural positions or exploring micro futures like MZC, precipitation patterns can provide vital context for your trades.
2. Corn’s Moisture Dependency
Corn is not just sensitive to water — it thrives or suffers because of it. From the moment seeds are planted, the crop enters a delicate dance with precipitation. Too little moisture during the early stages can impair root development. Too much during germination may lead to rot. And during pollination — particularly the tasseling and silking stages — insufficient rainfall can cause the plant to abort kernels, drastically reducing yield.
On the other hand, excessive rainfall isn't necessarily beneficial either. Prolonged wet periods can saturate soil, hinder nutrient uptake, and encourage fungal diseases. Farmers in the U.S. Corn Belt — particularly in states like Iowa, Illinois, and Nebraska — know this well. A single unexpected weather shift in these regions can send ripple effects across global markets, causing speculators to reassess their positions.
For traders, these weather events aren’t just environmental footnotes — they are catalysts that influence prices, volatility, and risk sentiment. And while annual production is important, it's the week-to-week rhythm of the growing season where short-term trades are born.
3. Our Data-Driven Approach: Weekly Rainfall and Corn Returns
To understand how rainfall impacts price, we collected and analyzed decades of historical weather and futures data, aligning weekly precipitation totals from major corn-growing regions with weekly returns from Corn Futures (ZC).
The weather data was normalized using percentiles for each location and week of the year. We then assigned each weekly observation to one of three precipitation categories:
Low rainfall (<25th percentile)
Normal rainfall (25th–75th percentile)
High rainfall (>75th percentile)
We then calculated the weekly percent change in corn futures prices and matched each return to the rainfall category for that week. The result was a dataset that let us measure not just general trends but statistically significant shifts in market behavior based on weather. One key finding stood out: the difference in returns between low-rainfall and high-rainfall weeks was highly significant, with a p-value of approximately 0.0006.
4. What the Numbers Tell Us
The results are striking. During low-rainfall weeks, corn futures often posted higher average returns, suggesting that the market responds to early signs of drought with anticipatory price rallies. Traders and institutions appear to adjust positions quickly when weather models hint at below-normal moisture during key growth stages.
In contrast, high-rainfall weeks displayed lower returns on average — and greater variability. While rain is essential, excess moisture raises fears of waterlogging, planting delays, and quality issues at harvest. The futures market, ever forward-looking, seems to price in both optimism and concern depending on the volume of rain.
Boxplots of these weekly returns reinforce the pattern: drier-than-usual weeks tend to tilt bullish, while wetter periods introduce uncertainty. For discretionary and algorithmic traders alike, this insight opens the door to strategies that incorporate weather forecasts into entry, exit, and risk models.
📊 Boxplot Chart: Weekly corn futures returns plotted against precipitation category (low, normal, high). This visual helps traders grasp how price behavior shifts under varying rainfall conditions.
5. Strategy: How Traders Can Position Themselves
With the clear statistical link between rainfall extremes and price behavior in corn futures, the logical next step is applying this insight to real-world trading. One straightforward approach is to incorporate weather forecast models into your weekly market prep. If a key growing region is expected to receive below-normal rainfall, that could serve as a signal for a potential bullish bias in the upcoming trading sessions.
This doesn’t mean blindly buying futures on dry weeks, but rather layering this data into a broader trading thesis. For example, traders could combine weather signals with volume surges, technical breakouts, or news sentiment to form confluence-based setups. On the risk management side, understanding how price behaves during extreme weather periods can inform smarter stop-loss placements, position sizing, or even the use of option strategies to protect against unexpected reversals.
Additionally, this information becomes particularly valuable during the planting and pollination seasons, when the corn crop is most vulnerable and the market reacts most strongly. Knowing the historical patterns of price behavior in those weeks — and aligning them with current forecast data — offers a clear edge that fundamental and technical analysis alone may not reveal.
🗺️ Global Corn Map Screenshot: A world map highlighting major corn-growing regions with weather overlay. This helps illustrate the geographic variability in rainfall and how it intersects with key production zones.
6. Corn Futures Contracts: Speculating with Flexibility
For traders looking to act on this kind of seasonal weather intelligence, CME Group provides two practical tools: the standard-size Corn Futures contract (ZC) and the Micro Corn Futures contract (MZC).
Here are some quick key points to remember:
Tick size for ZC is ¼ cent (0.0025) per bushel, equating to $12.50 per tick.
For MZC, each tick is 0.0050 equating to $2.50 per tick.
Standard ZC initial margin is approximately $1,000 and MZC margins are around $100 per contract, though this can vary by broker.
Micro contracts are ideal for those who want exposure to corn prices without the capital intensity of full-size contracts. They’re especially helpful for weather-based trades, where your thesis may rely on shorter holding periods, rapid scaling, or position hedging.
7. Conclusion: Rain’s Role in the Corn Trade
Precipitation isn’t just a farmer’s concern — it’s a trader’s opportunity. Our analysis shows that weather data, especially rainfall, has a statistically significant relationship with corn futures prices. By normalizing historical precipitation data and matching it to weekly returns, we uncovered a clear pattern: drought stress tends to lift prices, while excessive moisture creates volatility and downside risk.
For futures traders, understanding this dynamic adds another layer to market analysis.
As part of a broader series, this article is just one piece of a puzzle that spans multiple commodities and weather variables. Stay tuned for our upcoming releases, where we’ll continue exploring how nature’s forces shape the futures markets.
When charting futures, the data provided could be delayed. Traders working with the ticker symbols discussed in this idea may prefer to use CME Group real-time data plan on TradingView: www.tradingview.com - This consideration is particularly important for shorter-term traders, whereas it may be less critical for those focused on longer-term trading strategies.
General Disclaimer:
The trade ideas presented herein are solely for illustrative purposes forming a part of a case study intended to demonstrate key principles in risk management within the context of the specific market scenarios discussed. These ideas are not to be interpreted as investment recommendations or financial advice. They do not endorse or promote any specific trading strategies, financial products, or services. The information provided is based on data believed to be reliable; however, its accuracy or completeness cannot be guaranteed. Trading in financial markets involves risks, including the potential loss of principal. Each individual should conduct their own research and consult with professional financial advisors before making any investment decisions. The author or publisher of this content bears no responsibility for any actions taken based on the information provided or for any resultant financial or other losses.
Futurestrading
FX quarter end : a high-probability recurring patternAs we approach the end of June, a well-known phenomenon among FX traders is once again coming into focus: when currencies have diverged significantly over the course of a month or quarter, we often see a technical correction into the final trading session, with partial pullbacks in the pairs that had previously moved the most.
This end-of-month or quarter pattern is not random. It is the predictable result of recurring institutional flows. Recently, the US dollar has notably weakened against most major currencies. As a result, we could anticipate a modest bounce in the dollar to close out the month and start the new week, as various participants are likely to adjust their positions accordingly.
Performance of FX futures contracts from Sunday, June 1 to Friday, June 27:
Swiss Franc +3.71%
Euro +3.61%
British Pound +1.95%
New Zealand Dollar +1.58%
Australian Dollar +1.50%
Canadian Dollar +0.67%
Japanese Yen +0.16%
Performance of FX futures contracts from Tuesday, April 1 to Friday, June 27:
Swiss Franc +10.73%
Euro +8.40%
New Zealand Dollar +6.90%
British Pound +6.26%
Canadian Dollar +5.23%
Australian Dollar +4.80%
Japanese Yen +3.68%
These figures illustrate a broad-based decline in the dollar during June and over the entire second quarter. Historically, such imbalances open the door to late-stage adjustments, with currencies that have risen sharply often seeing modest technical pullbacks. This is a setup closely monitored by FX traders, who view it as a high-probability opportunity based on a pattern that is rare, but remarkably consistent.
FX rebalancing: mechanics and market players
At the heart of these adjustments lies one key concept: rebalancing. This is the process by which institutional players, pension funds, insurers, central banks, passive managers, bond funds, corporates adjust their FX exposures to stay in line with the targets defined in their mandates.
Every month, the value of their assets (equities, bonds, alternatives) and currency holdings fluctuate. If a currency appreciates sharply, its weight in the portfolio may become too high. Conversely, if a currency weakens, exposure might fall below target. Rebalancing involves buying or selling FX to return to those target allocations.
This process is recurring, predictable, and usually concentrated in a narrow window, the final hours of the trading month, just before the London 4pm fix. Quarter-ends tend to be even more pronounced, as many investors revisit long-term strategic allocations at that time.
Many of these adjustments are driven by systematic models using fixed thresholds, which adds to the consistency and timing of these flows.
Ideal setup: low volatility, high impact
June 2025 ends in a particularly calm environment: equity markets are stable or even rising, and the VIX is trading near its yearly lows, signs of a quiet and balanced market that favors more technical trading. This context is favorable for strategies aiming to take advantage of rebalancing effects, as in the absence of new announcements or unexpected events, these adjustments are likely to have a tangible impact on prices.
Conversely, in a more volatile market environment, such adjustments could be drowned out by larger flows (such as a flight to quality), thus having a reduced or even negligible impact.
FX options: another layer of flows
Another important factor on Monday, June 30: a large number of FX options expire at 10am New York (3pm London). These expiries cover several major pairs, with significant notional amounts concentrated near current spot levels.
According to what is currently being whispered on trading desk chat rooms, we expect the following large expiries:
EUR/USD: €3.0bn at 1.1650 (below spot)
USD/JPY: $1.6bn at 145.50 (above spot)
USD/CHF: $1.8bn at 0.8000 (above spot)
GBP/USD: £1.0bn at 1.3600 (below spot)
AUD/USD: A$1.1bn at 0.6425 (below spot)
When spot approaches these strikes, option holders or sellers may intervene to "pin" prices, based on their delta exposure. This behavior can amplify technical price movements in the hours before expiration.
When these heavy expirations align with month/quarter end rebalancing flows in a quiet, low-volatility market, it creates a strong potential cocktail for tactical moves, conducive to a dollar rebound into the fix.
How to trade the pattern effectively
Here’s a simplified roadmap to navigate this recurring pattern:
Identify monthly or quarterly extremes: look for the currencies that gained or lost the most over the period;
Assess the market environment: a low VIX, no major data or central bank events, meaningful trends, and significant options expiries are ideal conditions;
Use liquid and transparent instruments: Sep 2025 FX futures (standard, e-mini or micro) are currently the most suitable products for active positioning
Set realistic expectations: aim for a 0.5% to 1.0% pullback, not a full-blown trend reversal
Manage risk properly: as with any strategy, always use a stop-loss. This is quantitative trading, not fortune-telling. If the USD continues to weaken despite the setup, be ready to exit swiftly.
In short...
Quarter/month end FX rebalancing is one of the few market events where anticipated institutional flows can create repeatable, high-probability trading opportunities. These flows stem from real portfolio needs and systematic re-hedging, and are often amplified by option expiries and technical positioning.
This setup provides a great educational case study for any trader seeking to better understand hidden FX dynamics. There’s no secret indicator or crystal ball here, just a solid grasp of structural flows and timing.
From a personal standpoint, after over 20 years trading currencies, this strategy remains one of my favorites: simple, effective, and highly instructive. I encourage you to study it closely, and observe its behavior during upcoming month-end windows.
---
When charting futures, the data provided could be delayed. Traders working with the ticker symbols discussed in this idea may prefer to use CME Group real-time data plan on TradingView: tradingview.com/cme/ .
This consideration is particularly important for shorter-term traders, whereas it may be less critical for those focused on longer-term trading strategies.
General Disclaimer:
The trade ideas presented herein are solely for illustrative purposes forming a part of a case study intended to demonstrate key principles in risk management within the context of the specific market scenarios discussed. These ideas are not to be interpreted as investment recommendations or financial advice. They do not endorse or promote any specific trading strategies, financial products, or services. The information provided is based on data believed to be reliable; however, its accuracy or completeness cannot be guaranteed. Trading in financial markets involves risks, including the potential loss of principal. Each individual should conduct their own research and consult with professional financial advisors before making any investment decisions. The author or publisher of this content bears no responsibility for any actions taken based on the information provided or for any resultant financial or other losses.

US–Iran Conflict Triggers a Potential Nasdaq Bearish Setup🟣 Geopolitical Flashpoint Meets Technical Confluence
The U.S. weekend airstrike on Iranian nuclear facilities has reignited geopolitical instability across the Middle East. While broader markets often absorb news cycles quickly, high-beta assets like Nasdaq futures (NQ) tend to react more dramatically—especially when uncertainty meets existing technical vulnerability.
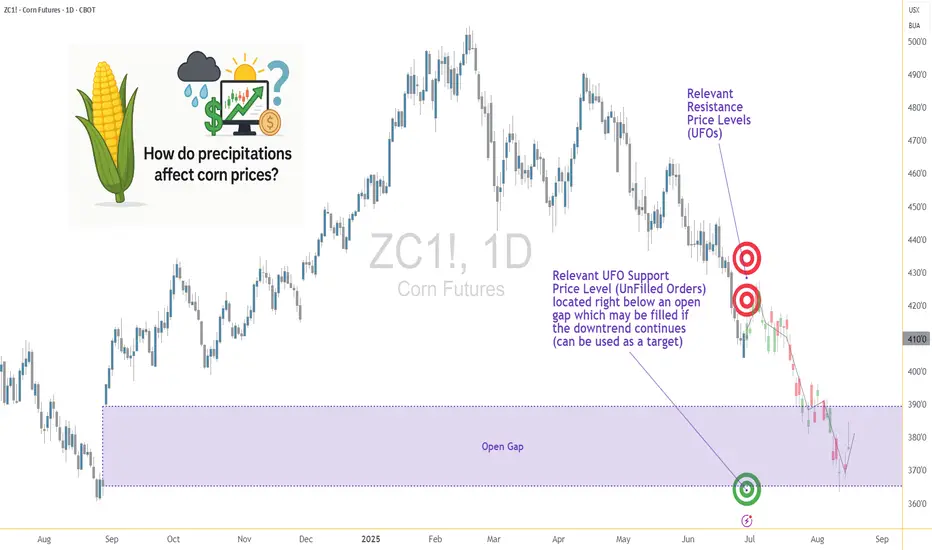
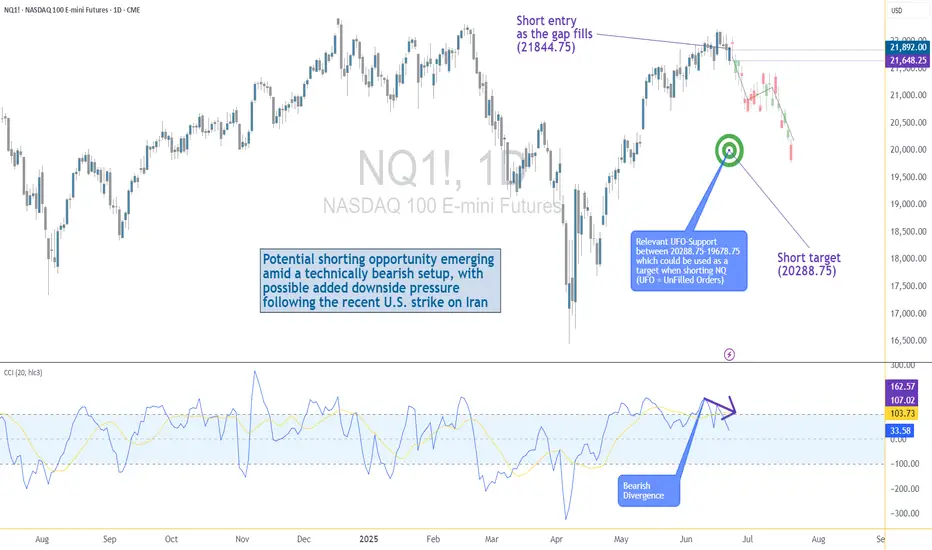
Monday’s session opened with a notable gap to the downside, reflecting immediate risk-off sentiment among futures traders. While the initial drop is being retraced intraday, historical patterns suggest that such gap-fills can often serve as ideal shorting zones—particularly when other bearish signals confirm the narrative. The backdrop is clear: this is no ordinary Monday open.
🟣 Bearish Divergence on CCI Builds the Case
From a technical standpoint, the setup gains weight through a clear bearish divergence on the Commodity Channel Index (CCI) using a 20-period setting. While prices recently pushed higher, momentum failed to follow—an early indication that buyers may be running out of steam. This divergence appears just as price approaches the origin of Friday’s gap, a level that frequently acts as a resistance magnet in such contexts. This confluence of weakening momentum and overhead supply aligns perfectly with the geopolitical catalyst, offering traders a compelling argument for a potential reversal in the short term.
🟣 Gap Origin: The Line in the Sand
The origin of the gap sits at 21844.75, a price level now acting as potential resistance. As the market attempts to climb back toward this zone, the likelihood of encountering institutional selling pressure increases. Gap origins often represent unfinished business—zones where prior bullish control was suddenly interrupted. In this case, the added layer of global tension only strengthens the conviction that sellers may look to reassert dominance here. If price action stalls or rejects at this zone, it could become the pivot point for a swift move lower, especially with bearish momentum already flashing caution signals.
🟣 Trade Plan and Reward-to-Risk Breakdown
A potential short trade could be structured using 21844.75 as the entry point—precisely at the gap origin. A conservative stop placement would rest just above the most recent swing high at 22222.00, offering protection against a temporary squeeze. The downside target aligns with a prior UFO support area near 20288.75, where demand previously showed presence. This sets up a risk of 377.25 points versus a potential reward of 1556.00 points, resulting in a reward-to-risk ratio of 4.12:1. For traders seeking asymmetrical opportunity, this ratio stands out as a strong incentive to engage with discipline.
🟣 Futures Specs: Know What You’re Trading
Traders should be aware of contract specifics before engaging. The E-mini Nasdaq-100 Futures (NQ) represent $20 per point, with a minimum tick of 0.25 worth $5.00. Typical margin requirements hover around $31,000, depending on the broker.
For smaller accounts, the Micro Nasdaq-100 Futures (MNQ) offer 1/10th the exposure. Each point is worth $2, with a $0.50 tick value and much lower margins near $3,100.
🟣 Discipline First: Why Risk Management Matters
Volatility driven by geopolitical events can deliver fast gains—but just as easily, fast losses. That’s why stop-loss orders are non-negotiable. Without one, traders expose themselves to unlimited downside, especially in leveraged instruments like futures. Equally critical is the precision of entry and exit levels. Acting too early or too late—even by a few points—can compromise an otherwise solid trade. Always size positions according to your account, and never let emotion override logic. Risk management isn’t a side-note—it’s the foundation that separates professionals from those who simply speculate.
When charting futures, the data provided could be delayed. Traders working with the ticker symbols discussed in this idea may prefer to use CME Group real-time data plan on TradingView: www.tradingview.com - This consideration is particularly important for shorter-term traders, whereas it may be less critical for those focused on longer-term trading strategies.
General Disclaimer:
The trade ideas presented herein are solely for illustrative purposes forming a part of a case study intended to demonstrate key principles in risk management within the context of the specific market scenarios discussed. These ideas are not to be interpreted as investment recommendations or financial advice. They do not endorse or promote any specific trading strategies, financial products, or services. The information provided is based on data believed to be reliable; however, its accuracy or completeness cannot be guaranteed. Trading in financial markets involves risks, including the potential loss of principal. Each individual should conduct their own research and consult with professional financial advisors before making any investment decisions. The author or publisher of this content bears no responsibility for any actions taken based on the information provided or for any resultant financial or other losses.
Heatwaves and Wheat: How Temperature Shocks Hit Prices🌾 Section 1: The Wheat–Weather Connection—Or Is It?
If there’s one crop whose success is often tied to the weather forecast, it’s wheat. Or so we thought. For decades, traders and analysts have sounded the alarm at the mere mention of a heatwave in key wheat-producing regions. The logic? Excessive heat during the growing season can impair wheat yields by disrupting pollination, shortening the grain-filling period, or damaging kernel development. A tightening supply should lead to price increases. Simple enough, right?
But here’s where the story takes an unexpected turn.
What happens when we actually analyze the data? Does heat reliably lead to price spikes in the wheat futures market? The short answer: not exactly. In fact, our statistical tests show that temperature may not have the consistent, directional impact on wheat prices that many traders believe it does.
And that insight could change how you think about risk, seasonality, and the role of micro contracts in your wheat trading strategy.
📈 Section 2: The Economics of Wheat—And Its Role in the Futures Market
Wheat isn’t just a breakfast staple—it’s the most widely grown crop in the world. It’s cultivated across North America, Europe, Russia, Ukraine, China, and India, making it a truly global commodity. Because wheat is produced and consumed everywhere, its futures markets reflect a wide array of influences: weather, geopolitics, global demand, and speculative positioning.
The Chicago Board of Trade (CBOT), operated by CME Group, is the main venue for wheat futures trading. It offers two primary wheat contracts:
Standard Wheat Futures (ZW)
Contract Size: 5,000 bushels
Tick Size: 1/4 cent per bushel (0.0025) has a $12.50 per tick impact
Margin Requirement: Approx. $1,700 (subject to change)
Micro Wheat Futures (MZW)
Contract Size: 500 bushels (1/10th the size of the standard contract)
Tick Size: 0.0050 per bushel has a $2.50 per tick impact
Margin Requirement: Approx. $170 (subject to change)
These micro contracts have transformed access to grain futures markets. Retail traders and smaller funds can now gain precise exposure to weather-driven moves in wheat without the capital intensity of the full-size contract.
🌡️ Section 3: Weather Normalization—A Smarter Way to Measure Impact
When analyzing weather, using raw temperature values doesn’t paint the full picture. What’s hot in Canada might be normal in India. To fix this, we calculated temperature percentiles per location over 40+ years of historical weather data.
This gave us three weekly categories:
Below 25th Percentile (Low Temp Weeks)
25th to 75th Percentile (Normal Temp Weeks)
Above 75th Percentile (High Temp Weeks)
Using this approach, we grouped thousands of weeks of wheat futures data and examined how price returns behaved under each condition. This way, we could compare a “hot” week in Ukraine to a “hot” week in the U.S. Midwest—apples to apples.
🔄 Section 4: Data-Driven Temperature Categories and Wheat Returns
To move beyond anecdotes and headlines, we then calculated weekly percent returns for wheat futures (ZW) for each of the three percentile-based categories.
What we found was surprising.
Despite common assumptions that hotter weeks push wheat prices higher, the average returns didn’t significantly increase during high-temperature periods. However, something else did: volatility.
In high-temp weeks, prices swung more violently — up or down — creating wider return distributions. But the direction of these moves lacked consistency. Some heatwaves saw spikes, others fizzled.
This insight matters. It means that extreme heat amplifies risk, even if it doesn't create a reliable directional bias.
Traders should prepare for greater uncertainty during hot weeks — an environment where tools like micro wheat futures (MZW) are especially useful. These contracts let traders scale exposure and control risk in turbulent market conditions tied to unpredictable weather.
🔬 Section 5: Statistical Shock—The t-Test Revelation
To confirm our findings, we ran two-sample t-tests comparing the returns during low vs. high temperature weeks. The goal? To test if the means of the two groups were statistically different.
P-Value (Temp Impact on Wheat Returns): 0.354 (Not Significant)
Conclusion: We cannot reject the hypothesis that average returns during low and high temp weeks are the same.
This result is counterintuitive. It flies in the face of narratives we often hear during weather extremes.
However, our volatility analysis (using boxplots) showed that variance in returns increases significantly during hotter weeks, making them less predictable and more dangerous for leveraged traders.
🧠 Section 6: What Traders Can Learn from This
This analysis highlights a few key lessons:
Narratives aren’t always backed by data. High heat doesn’t always mean high prices.
Volatility increases during weather stress. That’s tradable, but not in the way many assume.
Risk-adjusted exposure matters. Micro wheat futures (MZW) are ideal for navigating weather-driven uncertainty.
Multi-factor analysis is essential. Weather alone doesn’t explain price behavior. Global supply chains, speculative flows, and other crops’ performance all play a role.
This article is part of a growing series where we explore the relationship between weather and agricultural futures. From corn to soybeans to wheat, each crop tells a different story. Watch for the next release—we’ll be digging deeper into more effects and strategies traders can use to capitalize on weather.
When charting futures, the data provided could be delayed. Traders working with the ticker symbols discussed in this idea may prefer to use CME Group real-time data plan on TradingView: www.tradingview.com - This consideration is particularly important for shorter-term traders, whereas it may be less critical for those focused on longer-term trading strategies.
General Disclaimer:
The trade ideas presented herein are solely for illustrative purposes forming a part of a case study intended to demonstrate key principles in risk management within the context of the specific market scenarios discussed. These ideas are not to be interpreted as investment recommendations or financial advice. They do not endorse or promote any specific trading strategies, financial products, or services. The information provided is based on data believed to be reliable; however, its accuracy or completeness cannot be guaranteed. Trading in financial markets involves risks, including the potential loss of principal. Each individual should conduct their own research and consult with professional financial advisors before making any investment decisions. The author or publisher of this content bears no responsibility for any actions taken based on the information provided or for any resultant financial or other losses.

Volume Speaks Louder: My Custom Volume Indicator for Futures
My Indicator Philosophy: Think Complex, Model Simple
In my first “Modeling 101” class as an undergrad, I learned a mantra that’s stuck with me ever since: “Think complex, but model simple.” In other words, you can imagine all the complexities of a system, but your actual model doesn’t have to be a giant non-convex, nonlinear neural network or LLM—sometimes a straightforward, rule-based approach is all you need.
With that principle in mind, and given my passion for trading, I set out to invent an indicator that was both unique and useful. I knew countless indicators already existed, each reflecting its creator’s priorities—but none captured my goal: seeing what traders themselves are thinking in real time . After all, news is one driver of the market, but you can’t control or predict news. What you can observe is how traders react—especially intraday—so I wanted a simple way to gauge that reaction.
Why intraday volume ? Most retail traders (myself included) focus on shorter timeframes. When they decide to jump into a trade, they’re thinking within the boundaries of a single trading day. They rarely carry yesterday’s logic into today—everything “resets” overnight. If I wanted to see what intraday traders were thinking, I needed something that also resets daily. Price alone didn’t do it, because price continuously moves and never truly “starts over” each morning. Volume, however, does reset at the close. And volume behaves like buying/selling pressure—except that raw volume numbers are always positive, so they don’t tell you who is winning: buyers or sellers?
To turn volume into a “signed” metric, I simply use the candle’s color as a sign function. In Pine Script, that looks like:
isGreenBar = close >= open
isRedBar = close < open
if (not na(priceAtStartHour))
summedVolume += isGreenBar ? volume : -volume
This way, green candles add volume and red candles subtract volume, giving me positive values when buying pressure dominates and negative values when selling pressure dominates. By summing those signed volumes throughout the day, I get a single metric—let’s call it SummedVolume—that truly reflects intraday sentiment.
Because I focus on futures markets (which have a session close at 18:00 ET), SummedVolume needs to reset exactly at session close. In Pine, that reset is as simple as:
if (isStartOfSession())
priceAtStartHour := close
summedVolume := 0.0
Once that bar (6 PM ET) appears, everything zeroes out and a fresh count begins.
SummedVolume isn’t just descriptive—it generates actionable signals. When SummedVolume rises above a user-defined Long Threshold, that suggests intraday buying pressure is strong enough to consider a long entry. Conversely, when SummedVolume falls below a Short Threshold, that points to below-the-surface selling pressure, flagging a potential short. You can fine-tune those thresholds however you like, but the core idea remains:
• Positive SummedVolume ⇒ net buying pressure (bullish)
• Negative SummedVolume ⇒ net selling pressure (bearish)
Why do I think it works: Retail/intraday traders think in discrete days. They reset their mindset at the close. Volume naturally resets at session close, so by signing volume with candle color, I capture whether intraday participants are predominantly buying or selling—right now.
Once again: “Think complex, model simple.” My Daily Volume Delta (DVD) indicator may look deceptively simple, but five years of backtesting have proven its edge. It’s a standalone gauge of intraday sentiment, and it can easily be combined with other signals—moving averages, volatility bands, whatever you like—to amplify your strategy. So if you want a fresh lens on intraday momentum, give SummedVolume a try.

Weather and Corn: A Deep Dive into Temperature Impact1. Introduction: Corn and Climate – An Inseparable Relationship
For traders navigating the corn futures market, weather isn't just a background noise—it's a market mover. Few agricultural commodities are as sensitive to environmental variables as corn, especially temperature. Corn is grown across vast regions, and its development is directly tied to how hot or cold the season plays out. This makes weather not just a topic of interest but a core input in any corn trader’s playbook.
In this article, we go beyond conventional wisdom. Instead of simply assuming “hotter equals bullish,” we bring data into the equation—weather data normalized by percentile, matched with price returns on CME Group's corn futures. The results? Useful for anyone trading ZC or MZC contracts.
2. How Temperature Affects Corn Physiology and Yields
At the biological level, corn thrives best in temperatures between 77°F (25°C) and 91°F (33°C) during its growth stages. During pollination—a critical yield-defining window—extreme heat (especially above 95°F / 35°C) can cause irreversible damage. When hot weather coincides with drought, the impact on yields can be catastrophic.
Historical drought years like 2012 and 1988 serve as powerful examples. In 2012, persistent heat and dryness across the US Midwest led to a national yield drop of over 25%, sending futures skyrocketing. But heat doesn't always spell disaster. Timing matters. A heat wave in early June may have little impact. That same wave during tasseling in July? Major consequences.
3. The Market Mechanism: How Traders Respond to Temperature Surprises
Markets are forward-looking. Futures prices don’t just reflect today’s weather—they reflect expectations. A dry June may already be priced in by the time USDA issues its report. This dynamic creates an interesting challenge for traders: separating noise from signal.
During July and August—the critical reproductive phase—temperature updates from NOAA and private forecasters often trigger major moves. Rumors of an incoming heat dome? Corn futures might gap up overnight. But if it fizzles out, retracements can be just as dramatic. Traders who rely on headlines without considering what’s already priced in are often late to the move.
4. Our Analysis: What the Data Reveals About Corn and Temperature
To cut through the fog, we performed a percentile-based analysis using decades of weather and price data. Rather than looking at raw temperatures, we classified each week into temperature “categories”:
Low Temperature Weeks: Bottom 25% of the historical distribution
Normal Temperature Weeks: Middle 50%
High Temperature Weeks: Top 25%
We then analyzed weekly percentage returns for the corn futures contract (ZC) in each category. The outcome? On average, high-temperature weeks showed higher volatility—but not always higher returns. In fact, the data revealed that some extreme heat periods were already fully priced in, limiting upside.
5. Statistically Significant or Not? T-Tests and Interpretation
To test whether the temperature categories had statistically significant impacts on weekly returns, we ran a t-test comparing the “Low” vs. “High” temperature groups. The result: highly significant. Corn returns during high-temperature weeks were, on average, notably different than those during cooler weeks, with a p-value far below 0.01 (4.10854357245787E-13).
This tells us that traders can't ignore temperature anomalies. Extreme heat does more than influence the narrative—it materially shifts price behavior. That said, the direction of this shift isn't always bullish. Sometimes, high heat correlates with selling, especially if it’s viewed as destructive beyond repair.
6. Strategic Takeaways for Corn Traders
Traders can use this information in several ways:
Anticipatory Positioning: Use temperature forecasts to adjust exposure ahead of key USDA reports.
Risk Management: Understand that volatility spikes in extreme temperature conditions and plan stops accordingly.
Calendar Sensitivity: Prioritize weather signals more heavily in July than in May, when crops are less vulnerable.
Combining weather percentile models with weekly return expectations can elevate a trader’s edge beyond gut feel.
7. CME Group Corn Futures and Micro Corn Contracts
Corn traders have options when it comes to accessing this market. The flagship ZC futures contract from CME Group represents 5,000 bushels of corn and is widely used by commercial hedgers and speculators alike. For those seeking more precision or lower capital requirements, the recently launched Micro Corn Futures (MZC) represent just 1/10th the size.
This fractional sizing makes temperature-driven strategies more accessible to retail traders, allowing them to deploy seasonal or event-based trades without excessive risk exposure.
Here are some quick key points to remember:
Tick size for ZC is ¼ cent (0.0025) per bushel, equating to $12.50 per tick.
For MZC, each tick is 0.0050 equating to $2.50 per tick.
Standard ZC initial margin is approximately $1,000 and MZC margins are around $100 per contract, though this can vary by broker.
8. Wrapping Up: Temperature's Role in a Complex Equation
While temperature is a key driver in corn futures, it doesn't act in isolation. Precipitation, global demand, currency fluctuations, and government policies also play crucial roles. However, by quantifying the impact of extreme temperatures, traders gain a potential edge in anticipating market behavior.
Future articles will expand this framework to include precipitation, international weather events, and multi-variable models.
This article is part of a broader series exploring how weather impacts the corn, wheat, and soybean futures markets. Stay tuned for the next release, which builds directly on these insights.
When charting futures, the data provided could be delayed. Traders working with the ticker symbols discussed in this idea may prefer to use CME Group real-time data plan on TradingView: www.tradingview.com - This consideration is particularly important for shorter-term traders, whereas it may be less critical for those focused on longer-term trading strategies.
General Disclaimer:
The trade ideas presented herein are solely for illustrative purposes forming a part of a case study intended to demonstrate key principles in risk management within the context of the specific market scenarios discussed. These ideas are not to be interpreted as investment recommendations or financial advice. They do not endorse or promote any specific trading strategies, financial products, or services. The information provided is based on data believed to be reliable; however, its accuracy or completeness cannot be guaranteed. Trading in financial markets involves risks, including the potential loss of principal. Each individual should conduct their own research and consult with professional financial advisors before making any investment decisions. The author or publisher of this content bears no responsibility for any actions taken based on the information provided or for any resultant financial or other losses.

Trading Gold? Know the Difference Between XAU/USD and Futures🔎 Let’s address a question I get very often:
“Should I trade spot gold (XAU/USD) or Gold futures?”
It might sound like a technical decision, but it’s actually about how you approach the market, your risk profile, and your experience level.
So let’s break it down 👇
________________________________________
🟡 Two ways to trade the same asset
Both spot and futures allow you to speculate on the price of Gold. But they’re two very different beasts when it comes to execution, capital, and strategy.
________________________________________
1️⃣ Spot gold (XAU/USD)
• Traded mostly via Forex brokers or CFD platforms
• No expiration — you can hold the position as long as you want
• Often used by retail traders for day trading or swing setups
• You can open small trades (even 0.01 lots)
• Costs include spread, swap fees if you hold overnight
• Leverage is usually high — up to 1:100 or more
• Margin is required, but typically lower than in futures
💡 Spot is flexible and accessible, but you pay the price through overnight holding costs, wider spreads during volatility, and slippage. On some brokers, especially during high-impact news, your platform might even freeze or delay execution — and that’s a serious risk if you’re not prepared.
________________________________________
2️⃣ Gold futures (GC)
• Traded on major futures exchanges like CME
• Contracts have a fixed size (usually 100 oz)
• They expire monthly, so you need to manage rollovers
• Common among hedge funds and experienced traders
• You pay commissions and exchange fees, but no swaps
• Margin is required here too — but it's much higher
💡 Futures are structured and professional — but they demand more capital, stricter execution discipline, and higher margin requirements. Just like in spot trading, margin is a collateral deposit, not a cost — but with futures, the bar is set higher.
________________________________________
⚖️ So, which one is for you?
If you're using MetaTrader or any platform offered by a Forex/CFD broker, and you're a scalper, intraday, or swing trader working with flexible position sizes...
→ You're probably better off with spot gold (XAU/USD).
If you're trading big volume, managing diversified portfolios, or involved in hedging large exposure...
→ You should consider futures — but expect to level up your game, capital requirements, and discipline.
________________________________________
🧠 Mindset:
Don’t confuse accessibility with simplicity.
Just because spot Gold is easier to open doesn’t mean it’s always the best choice.
Just because futures look “pro-level” doesn’t mean they’re always worth it for a retail trader.
Understand your tools. Pick the one that aligns with your structure. That’s how you stay in the game. 🎯
________________________________________
📚 Hope this cleared it up. If you want me to cover execution setups for each one, let me know in the comments.

Soybeans: The Global Protein Powerhouse🟡 1. Introduction
Soybeans might not look like much at first glance — small, round, unassuming. But behind every bean lies a global story of protein demand, export flows, and economic policy.
They feed livestock, fuel vehicles, nourish entire populations, and move markets. In fact, soybeans sit at the intersection of agriculture, industry, and geopolitics — making them one of the most actively traded and strategically watched commodities in the world.
If you’re looking to understand how soybeans move markets — and how you can trade them effectively — this article is your starting point.
🌍 2. Why the World Cares About Soybeans
Few agricultural commodities carry the weight soybeans do. Their importance spans both the food and energy sectors — and their global footprint is enormous.
Here’s why they matter:
Protein Meal: After processing, about 80% of the soybean becomes high-protein meal used to feed poultry, pigs, and cattle.
Soybean Oil: Roughly 20% is extracted as oil — a key ingredient in cooking, industrial products, and increasingly, biodiesel.
Biofuels: As the push for renewable energy grows, soybean oil plays a major role in sustainable fuel strategies.
Top producers:
United States — historically the world’s largest producer.
Brazil — now rivals or exceeds U.S. production in some years.
Argentina — a dominant player in soybean meal and oil exports.
Top importers:
China — imports over 60% of globally traded soybeans.
EU, Mexico, Japan — also large buyers.
Soybeans are a bridge commodity — connecting livestock feed, food manufacturing, and renewable energy. That’s why traders from Chicago to Shanghai watch every yield forecast and export announcement closely.
💹 3. CME Group Soybean Contracts
Soybeans trade on the CME Group’s CBOT platform, with two main futures products:
o Standard Soybeans
Ticker: ZS
Size = 5,000 bushels
Tick = 0.0025 = $12.50
Margin = ~$2,150
o Micro Soybeans
Ticker: MZS
Size = 500 bushels
Tick = 0.0050 = $2.50
Margin = ~$215
Soybean futures are among the most actively traded agricultural contracts, offering deep liquidity, tight spreads, and excellent volatility for strategic traders. Keep in mind that margins are subject to change — always confirm with your broker. Micro contracts are ideal for scaling in/out of trades or learning market structure without large capital risk.
📅 4. The Soybean Calendar
Soybeans follow a seasonal cycle that creates rhythm in the market — and a potential edge for informed traders.
In the United States:
🌱 Planting: Late April to early June
☀️ Pod development / blooming: July and early August (weather-sensitive)
🌾 Harvest: September through November
In Brazil:
🌱 Planting: October to December
🌾 Harvest: February through April
This staggered calendar means that soybean markets have multiple weather risk windows each year. It also means the export flows and global pricing dynamics shift between the Northern and Southern Hemispheres throughout the calendar year.
That’s why soybeans tend to have two major volatility windows — mid-summer (U.S. crop concerns) and early Q1 (South American weather). Traders often build seasonal strategies around these patterns — buying weakness before key USDA reports, fading rallies during overbought harvests, or trading futures spreads between U.S. and Brazilian supply flows.
🔄 5. How Soybeans Are Traded Globally
Soybeans move through a complex international web of growers, crushers, exporters, and consumers. As a trader, understanding this flow is essential — because each node introduces price risk, opportunity, and reaction points.
Key players:
o Hedgers:
U.S. and Brazilian farmers hedge production risk using futures or options on futures.
Exporters hedge shipping schedules against fluctuating basis and FX risk.
o Crushers:
Companies like Cargill or Bunge buy soybeans to crush into meal and oil.
Crush margin (aka “board crush”) affects demand and influences futures spreads.
o Speculators:
Institutional funds trade soybeans as a macro or relative value play.
Retail traders use micro contracts (MZS) to capture directional or seasonal moves.
o China:
Its purchasing pace (or sudden cancellations) can move markets dramatically.
Announcements of bulk U.S. purchases could trigger short-covering rallies.
Additionally, soybeans are sometimes traded indirectly via their by-products:
Soybean Meal (ZM)
Soybean Oil (ZL)
These contracts often lead or lag ZS based on demand shifts in feed or fuel.
📈 6. What Makes Soybeans Unique to Trade
Compared to wheat and corn, soybeans are:
More weather-sensitive during July and August (especially to drought and heat).
More globally integrated, thanks to China’s dominant import role.
More complex, due to crush dynamics and multiple end-use markets.
This multifaceted nature is why many professional traders monitor soybeans, even if they aren’t actively trading them every week.
📌 7. Summary / Takeaway
Soybeans are one of the most important — and most tradable — commodities in the world. They feed livestock, fuel industry, and anchor the agricultural markets across two hemispheres.
Their unique role in food, fuel, and feed makes them more than just another contract — they’re a barometer for global health, demand, and policy.
Whether you’re trading the standard ZS contract or getting started with MZS, mastering soybeans means understanding weather, trade flows, product demand, and seasonality.
🧭 This article is part of our agricultural futures trading series.
📅 Watch for the next release: “Weather and Corn: A Deep Dive into Temperature Impact”
When charting futures, the data provided could be delayed. Traders working with the ticker symbols discussed in this idea may prefer to use CME Group real-time data plan on TradingView: www.tradingview.com - This consideration is particularly important for shorter-term traders, whereas it may be less critical for those focused on longer-term trading strategies.
General Disclaimer:
The trade ideas presented herein are solely for illustrative purposes forming a part of a case study intended to demonstrate key principles in risk management within the context of the specific market scenarios discussed. These ideas are not to be interpreted as investment recommendations or financial advice. They do not endorse or promote any specific trading strategies, financial products, or services. The information provided is based on data believed to be reliable; however, its accuracy or completeness cannot be guaranteed. Trading in financial markets involves risks, including the potential loss of principal. Each individual should conduct their own research and consult with professional financial advisors before making any investment decisions. The author or publisher of this content bears no responsibility for any actions taken based on the information provided or for any resultant financial or other losses.

Breadbasket Basics: Trading Wheat Futures🟡 1. Introduction
Wheat may be a breakfast-table staple, but for traders, it’s a globally sensitive asset — a commodity that reacts to geopolitics, climate patterns, and shifting demand from dozens of countries.
Despite its critical role in food security and its status as one of the most traded agricultural commodities, wheat is often overlooked by traders who focus on corn or soybeans. Yet wheat offers a unique combination of liquidity, volatility, and macro sensitivity that makes it highly attractive for both hedgers and speculators.
If you’re new to trading wheat, this guide gives you a solid foundation: how the wheat market works, who the key players are, and what makes wheat such a dynamic futures product.
🌍 2. Types of Wheat and Where It Grows
One of the first things traders need to understand is that wheat is not a single, uniform product. It’s a diverse group of grain types, each with its own characteristics, end uses, and pricing dynamics.
The major classes of wheat include:
Hard Red Winter (HRW): High-protein wheat grown in the central U.S. — used in bread and baking.
Soft Red Winter (SRW): Lower protein, used for pastries and crackers.
Hard Red Spring (HRS): Grown in the Northern Plains; prized for high gluten content.
Durum Wheat: Used for pasta, grown mainly in North Dakota and Canada.
White Wheat: Grown in the Pacific Northwest; used for noodles and cereals.
Each class responds differently to weather, demand, and regional risks — giving traders multiple ways to diversify or hedge.
Major global producers include:
United States
Russia
Canada
Ukraine
European Union
Australia
India
These regions experience different planting and harvesting calendars — and their weather cycles are often out of sync. This creates trading opportunities year-round.
🛠️ 3. CME Group Wheat Contracts
Wheat futures are traded on the Chicago Board of Trade (CBOT), part of the CME Group.
Here are the two key contracts:
o Standard Wheat
Ticker: ZW
Size = 5,000 bushels
Tick = 0.0025 = $12.50
Margin = ~$1,750
o Micro Wheat
Ticker: MZW
Size = 500 bushels
Tick = 0.0050 = $2.50
Margin = ~$175
Keep in mind that margins are subject to change — always confirm with your broker. Micro contracts are ideal for scaling in/out of trades or learning market structure without large capital risk.
📅 4. Wheat’s Seasonality and Supply Chain
Unlike corn or soybeans, wheat is planted and harvested across multiple seasons depending on the variety and geography.
In the U.S., winter wheat (HRW and SRW) is planted in the fall (September–November) and harvested in early summer (May–July). Spring wheat (HRS) is planted in spring (April–May) and harvested late summer.
Globally, things get even more staggered:
Australia’s wheat is harvested in November–December
Ukraine and Russia harvest in June–August
Argentina’s crop comes off the fields in December–January
This scattered global schedule means news headlines about one country’s weather or war (think Ukraine in 2022) can quickly shift sentiment across the entire futures curve.
📈 5. Who Trades Wheat and Why
Wheat is traded by a wide range of participants — each with their own objectives and strategies. Understanding their behavior can give you an edge in anticipating market moves.
Commercial hedgers:
Farmers lock in prices to protect against adverse weather or market crashes.
Grain elevators and exporters use futures to manage inventory risk.
Flour mills hedge their input costs to protect profit margins.
Speculators:
Hedge funds and CTAs trade wheat based on global macro trends, weather anomalies, or technical setups.
Retail traders increasingly use micro contracts to gain exposure to agricultural markets with lower capital risk.
Spread traders bet on pricing differences between wheat classes or harvest years.
🔍 For retail traders especially, micro contracts like XW open the door to professional markets without oversized exposure.
🧠 6. What Makes Wheat Unique in Futures Markets
Wheat is often considered the most geopolitically sensitive of the major grains. Here’s why:
Price can spike fast — even on rumor alone (e.g., export bans or missile strikes near ports).
Production risks are global — the market reacts not just to the U.S. crop, but to conditions in Russia, Ukraine, and Australia.
Storage and quality matter — protein levels and moisture content affect milling demand.
Unlike corn, wheat doesn’t have a single dominant industrial use (like ethanol). This means food demand is king, and food security often drives policy decisions that affect futures pricing.
📌 7. Summary / Takeaway
Wheat may not get as much media attention as corn or soybeans, but it’s a deeply important — and deeply tradable — market. Its global footprint, class differences, and sensitivity to weather and politics make it a must-know for serious agricultural futures traders.
Whether you're just starting out or looking to diversify your trading playbook, understanding wheat is an essential step. Learn its rhythms, follow its news, and respect the fact that every crop cycle brings a new story to the market.
🧭 This article is part of an ongoing educational series exploring futures trading in agricultural commodities.
📅 Watch for the next release: “Soybeans: The Global Protein Powerhouse.”
When charting futures, the data provided could be delayed. Traders working with the ticker symbols discussed in this idea may prefer to use CME Group real-time data plan on TradingView: www.tradingview.com - This consideration is particularly important for shorter-term traders, whereas it may be less critical for those focused on longer-term trading strategies.
General Disclaimer:
The trade ideas presented herein are solely for illustrative purposes forming a part of a case study intended to demonstrate key principles in risk management within the context of the specific market scenarios discussed. These ideas are not to be interpreted as investment recommendations or financial advice. They do not endorse or promote any specific trading strategies, financial products, or services. The information provided is based on data believed to be reliable; however, its accuracy or completeness cannot be guaranteed. Trading in financial markets involves risks, including the potential loss of principal. Each individual should conduct their own research and consult with professional financial advisors before making any investment decisions. The author or publisher of this content bears no responsibility for any actions taken based on the information provided or for any resultant financial or other losses.

Behind the Curtain The Economic Pulse Behind Euro FX1. Introduction
Euro FX Futures (6E), traded on the CME, offer traders exposure to the euro-dollar exchange rate with precision, liquidity, and leverage. Whether hedging European currency risk or speculating on macro shifts, Euro FX contracts remain a vital component of global currency markets.
But what truly moves the euro? Beyond central bank meetings and headlines, the euro reacts sharply to macroeconomic data that signals growth, inflation, or risk appetite. Using a Random Forest Regressor, we explored how economic indicators correlate with Euro FX Futures returns across different timeframes.
In this article, we uncover which metrics drive the euro daily, weekly, and monthly, offering traders a structured, data-backed approach to navigating the Euro FX landscape.
2. Understanding Euro FX Futures Contracts
The CME offers two primary Euro FX Futures products:
o Standard Euro FX Futures (6E):
Contract Size: 125,000 €
Tick Size: 0.000050 per euro = $6.25 per tick per contract
Trading Hours: Nearly 24 hours, Sunday to Friday (US)
o Micro Euro FX Futures (M6E):
Contract Size: 12,500 € (1/10th the size of 6E)
Tick Size: 0.0001 per euro = $1.25 per tick per contract
Accessible to: Smaller accounts, strategy testers, and traders managing precise exposure
o Margins:
6E Initial Margin: ≈ $2,600 per contract (subject to volatility)
M6E Initial Margin: ≈ $260 per contract
Whether trading full-size or micro contracts, Euro FX Futures offer capital-efficient access to one of the most liquid currency pairs globally. Traders benefit from leverage, scalability, and transparent pricing, with the ability to hedge or speculate on Euro FX trends across timeframes.
3. Daily Timeframe: Key Economic Indicators
For day traders, short-term price action in the euro often hinges on rapidly released data that affects market sentiment and intraday flow. According to machine learning results, the top 3 daily drivers are:
Housing Starts: Surging housing starts in the U.S. can signal economic strength and pressure the euro via stronger USD flows. Conversely, weaker construction activity may weaken the dollar and support the euro.
Consumer Sentiment Index: A sentiment-driven metric that reflects household confidence. Optimistic consumers suggest robust consumption and a firm dollar, while pessimism may favor EUR strength on defensive rotation.
Housing Price Index (HPI): Rising home prices can stoke inflation fears and central bank hawkishness, affecting yield differentials between the euro and the dollar. HPI moves often spark short-term FX volatility.
4. Weekly Timeframe: Key Economic Indicators
Swing traders looking for trends spanning several sessions often lean on energy prices and labor data. Weekly insights from our Random Forest model show these three indicators as top drivers:
WTI Crude Oil Prices: Oil prices affect global inflation and trade dynamics. Rising WTI can fuel EUR strength if it leads to USD weakness via inflation concerns or reduced real yields.
Continuing Jobless Claims: An uptick in claims may suggest softening labor conditions in the U.S., potentially bullish for EUR as it implies slower Fed tightening or economic strain.
Brent Crude Oil Prices: As the global benchmark, Brent’s influence on inflation and trade flows is significant. Sustained Brent rallies could create euro tailwinds through weakening dollar momentum.
5. Monthly Timeframe: Key Economic Indicators
Position traders and institutional participants often focus on macroeconomic indicators with structural weight—those that influence monetary policy direction, capital flow, and long-term sentiment. The following three monthly indicators emerged as dominant forces shaping Euro FX Futures:
Industrial Production: A cornerstone of economic output, rising industrial production reflects strong manufacturing activity. Strong U.S. numbers can support the dollar, while a slowdown may benefit the euro. Likewise, weaker European output could undermine EUR demand.
Velocity of Money (M2): This metric reveals how quickly money is circulating in the economy. A rising M2 velocity suggests increased spending and inflationary pressures—potentially positive for the dollar and negative for the euro. Falling velocity signals stagnation and may shift flows into the euro as a lower-yield alternative.
Initial Jobless Claims: While often viewed weekly, the monthly average could reveal structural labor market resilience. A rising trend may weaken the dollar, reinforcing EUR gains as expectations for interest rate cuts grow.
6. Strategy Alignment by Trading Style
Each indicator offers unique insights depending on your approach to market participation:
Day Traders: Focus on the immediacy of daily indicators like Housing Starts, Consumer Sentiment, and Housing Price Index.
Swing Traders: Leverage weekly indicators like Crude Oil Prices and Continuing Claims to ride mid-term moves.
Position Traders: Watch longer-term data such as Industrial Production and M2 Velocity.
7. Risk Management
Currency futures provide access to high leverage and broad macro exposure. With that comes responsibility. Traders must actively manage position sizing, volatility exposure, and stop placement.
Economic indicators inform price movement probabilities—not certainties—making risk protocols just as essential as trade entries.
8. Conclusion
Euro FX Futures are shaped by a deep web of macroeconomic forces. From Consumer Sentiment and Oil Prices to Industrial Production and Money Velocity, each indicator tells part of the story behind Euro FX movement.
Thanks to machine learning, we’ve spotlighted the most impactful data across timeframes, offering traders a framework to align their approach with the heartbeat of the market.
As we continue the "Behind the Curtain" series, stay tuned for future editions uncovering the hidden economic forces behind other major futures markets.
When charting futures, the data provided could be delayed. Traders working with the ticker symbols discussed in this idea may prefer to use CME Group real-time data plan on TradingView: www.tradingview.com - This consideration is particularly important for shorter-term traders, whereas it may be less critical for those focused on longer-term trading strategies.
General Disclaimer:
The trade ideas presented herein are solely for illustrative purposes forming a part of a case study intended to demonstrate key principles in risk management within the context of the specific market scenarios discussed. These ideas are not to be interpreted as investment recommendations or financial advice. They do not endorse or promote any specific trading strategies, financial products, or services. The information provided is based on data believed to be reliable; however, its accuracy or completeness cannot be guaranteed. Trading in financial markets involves risks, including the potential loss of principal. Each individual should conduct their own research and consult with professional financial advisors before making any investment decisions. The author or publisher of this content bears no responsibility for any actions taken based on the information provided or for any resultant financial or other losses.

Behind the Curtain: Unveiling Gold’s Economic Catalysts1. Introduction
Gold Futures (GC, MGC and 1OZ), traded on the CME market, are one of the most widely used financial instruments for hedging against inflation, currency fluctuations, and macroeconomic uncertainty. As a safe-haven asset, gold reacts to a wide range of economic indicators, making it crucial for traders to understand the underlying forces driving price movements.
By leveraging machine learning, specifically a Random Forest Regressor, we analyze the top economic indicators influencing Gold Futures on daily, weekly, and monthly timeframes. This data-driven approach reveals the key catalysts shaping GC Futures and provides traders with actionable insights to refine their strategies.
2. Understanding Gold Futures Contracts
Gold Futures (GC) are among the most actively traded futures contracts, offering traders and investors exposure to gold price movements with a range of contract sizes to suit different trading strategies. CME Group provides three types of Gold Futures contracts to accommodate traders of all levels:
o Standard Gold Futures (GC):
Contract Size: Represents 100 troy ounces of gold.
Tick Size: Each tick is 0.10 per ounce, equating to $10 per tick per contract.
Purpose: Ideal for institutional traders and large-scale hedgers.
Margin: Approximately $12,500 per contract.
o Micro Gold Futures (MGC):
Contract Size: Represents 10 troy ounces of gold, 1/10th the size of the standard GC contract.
Tick Size: Each tick is $1 per contract.
Purpose: Allows smaller-scale traders to participate in gold markets with lower capital requirements.
Margin: Approximately $1,250 per contract.
o 1-Ounce Gold Futures (1OZ):
Contract Size: Represents 1 troy ounce of gold.
Tick Size: Each tick is 0.25 per ounce, equating to $0.25 per tick per contract.
Purpose: Provides precision trading for retail participants who want exposure to gold at a smaller contract size.
Margin: Approximately $125 per contract.
Keep in mind that margin requirements vary through time as market volatility changes.
3. Daily Timeframe: Key Economic Indicators
Gold Futures respond quickly to short-term economic fluctuations, and three key indicators play a crucial role in daily price movements:
o Velocity of Money (M2):
Measures how quickly money circulates within the economy.
A higher velocity suggests increased spending and inflationary pressure, often boosting gold prices.
A lower velocity indicates stagnation, which may reduce inflation concerns and weigh on gold.
o Unemployment Rate:
Reflects the strength of the labor market.
Rising unemployment increases economic uncertainty, often driving demand for gold as a safe-haven asset.
Declining unemployment can strengthen risk assets, potentially reducing gold’s appeal.
o Oil Import Price Index:
Represents the cost of imported crude oil, influencing inflation trends.
Higher oil prices contribute to inflationary pressures, supporting gold as a hedge.
Lower oil prices may ease inflation concerns, weakening gold demand.
4. Weekly Timeframe: Key Economic Indicators
While daily fluctuations impact short-term traders, weekly economic data provides a broader perspective on gold price movements. The top weekly indicators include:
o Nonfarm Payrolls (NFP):
Measures the number of new jobs added in the U.S. economy each month.
Strong NFP numbers typically strengthen the U.S. dollar and increase interest rate hike expectations, pressuring gold prices.
Weak NFP figures can drive economic uncertainty, increasing gold’s safe-haven appeal.
o Nonfarm Productivity:
Represents labor efficiency and economic output per hour worked.
Rising productivity suggests economic growth, potentially reducing demand for gold.
Falling productivity can signal economic weakness, increasing gold’s appeal.
o Personal Spending:
Tracks consumer spending habits, influencing economic activity and inflation expectations.
Higher spending can lead to inflation, often pushing gold prices higher.
Lower spending suggests economic slowing, which may either weaken or support gold depending on inflationary outlooks.
5. Monthly Timeframe: Key Economic Indicators
Long-term trends in Gold Futures are shaped by macroeconomic forces that impact investor sentiment, inflation expectations, and interest rates. The most influential monthly indicators include:
o China GDP Growth Rate:
China is one of the largest consumers of gold, both for investment and jewelry.
Strong GDP growth signals robust demand for gold, pushing prices higher.
Slower growth may weaken gold demand, applying downward pressure on prices.
o Corporate Bond Spread (BAA - 10Y):
Measures the risk premium between corporate bonds and U.S. Treasury bonds.
A widening spread signals economic uncertainty, increasing demand for gold as a safe-haven asset.
A narrowing spread suggests confidence in risk assets, potentially reducing gold’s appeal.
o 10-Year Treasury Yield:
Gold has an inverse relationship with bond yields since it does not generate interest.
Rising yields increase the opportunity cost of holding gold, often leading to price declines.
Falling yields make gold more attractive, leading to price appreciation.
6. Risk Management Strategies
Given gold’s volatility and sensitivity to macroeconomic changes, risk management is essential for trading GC Futures. Key risk strategies may include:
Monitoring Global Liquidity Conditions:
Keep an eye on M2 Money Supply and inflation trends to anticipate major shifts in gold pricing.
Interest Rate Sensitivity:
Since gold competes with yield-bearing assets, traders should closely track interest rate movements.
Higher 10-Year Treasury Yields can weaken gold’s value as a non-yielding asset.
Diversification and Hedging:
Traders can hedge gold positions using interest rate-sensitive assets such as bonds or inflation-linked securities.
Gold often performs well in times of equity market distress, making it a commonly used portfolio diversifier.
7. Conclusion
Gold Futures remain one of the most influential instruments in the global financial markets.
By leveraging machine learning insights and macroeconomic data, traders can better position themselves for profitable trading opportunities. Whether trading daily, weekly, or monthly trends, understanding these indicators allows market participants to align their strategies with broader economic conditions.
Stay tuned for the next "Behind the Curtain" installment, where we explore economic forces shaping another key futures market.
When charting futures, the data provided could be delayed. Traders working with the ticker symbols discussed in this idea may prefer to use CME Group real-time data plan on TradingView: www.tradingview.com - This consideration is particularly important for shorter-term traders, whereas it may be less critical for those focused on longer-term trading strategies.
General Disclaimer:
The trade ideas presented herein are solely for illustrative purposes forming a part of a case study intended to demonstrate key principles in risk management within the context of the specific market scenarios discussed. These ideas are not to be interpreted as investment recommendations or financial advice. They do not endorse or promote any specific trading strategies, financial products, or services. The information provided is based on data believed to be reliable; however, its accuracy or completeness cannot be guaranteed. Trading in financial markets involves risks, including the potential loss of principal. Each individual should conduct their own research and consult with professional financial advisors before making any investment decisions. The author or publisher of this content bears no responsibility for any actions taken based on the information provided or for any resultant financial or other losses.

What Are Financial Derivatives and How to Trade Them?What Are Financial Derivatives and How to Trade Them?
Financial derivatives are powerful instruments used by traders to speculate on market movements or manage risk. From futures to CFDs, derivatives offer potential opportunities across global markets. This article examines “What is a derivative in finance?”, delving into the main types of derivatives, how they function, and key considerations for traders.
What Are Derivatives?
A financial derivative is a contract with its value tied to the performance of an underlying asset. These assets can include stocks, commodities, currencies, ETFs, or market indices. Instead of buying the asset itself, traders and investors use derivatives to speculate on price movements or manage financial risk.
Fundamentally, derivatives are contracts made between two parties. They allow one side to take advantage of changes in the asset's price, whether it rises or falls. For example, a futures contract locks in a price for buying or selling an asset on a specific date, while a contract for difference (CFD) helps traders speculate on the price of an asset without owning it.
The flexibility of derivatives is what makes them valuable. They can hedge against potential losses, potentially amplify returns through leverage, or provide access to otherwise difficult-to-trade markets. Derivatives are traded either on regulated exchanges or through over-the-counter (OTC) markets, each with distinct benefits and risks.
Leverage is a very common feature in derivative trading, enabling traders to control larger positions with less capital. However, it’s worth remembering that while this amplifies potential returns, it equally increases the risk of losses.
These instruments play a pivotal role in modern finance, offering tools to navigate market volatility or target specific investment goals. However, their complexity means they require careful understanding and strategic use to potentially avoid unintended risks.
Key Types of Financial Derivatives
There are various types of derivatives, each tailored to different trading strategies and financial needs. Understanding the main type of derivative can help traders navigate their unique features and applications. Below are the most common examples of derivatives:
Futures Contracts
Futures involve a contract to buy or sell an asset at a set price on a specific future date. These contracts are standardised and traded on exchanges, making them transparent and widely accessible. Futures are commonly used in commodities markets—like oil or wheat—but also extend to indices and currencies. Traders commonly utilise this type of derivative to potentially manage risks associated with price fluctuations or to speculate on potential market movements.
Forward Contracts
A forward contract is a financial agreement in which two parties commit to buying or selling an asset at a predetermined price on a specified future date. Unlike standardised futures contracts, forward contracts are customizable and traded privately, typically over-the-counter (OTC). These contracts are commonly used for hedging or speculating on price movements of assets such as commodities, currencies, or financial instruments.
Swaps
Swaps are customised contracts, typically traded over-the-counter (OTC). The most common types are interest rate swaps, where two parties agree to exchange streams of interest payments based on a specified notional amount over a set period, and currency swaps, which involve the exchange of principal and interest payments in different currencies. Swaps are primarily used by institutions to manage long-term exposure to interest rates or currency risks.
Contracts for Difference (CFDs)
CFDs allow traders to speculate on price changes of an underlying asset. They are flexible, covering a wide range of markets such as shares, commodities, and indices. CFDs are particularly attractive as they allow traders to speculate on rising and falling prices of an asset without owning it. Moreover, CFDs provide potential opportunities for short-term trading, which may be unavailable with other financial instruments.
Trading Derivatives: Mechanisms and Strategies
Trading derivatives revolves around two primary methods: exchange-traded and over-the-counter (OTC) markets. Each offers potential opportunities for traders, depending on their goals and risk tolerance.
Exchange-Traded Derivatives
These derivatives, like futures, are standardised and traded on regulated exchanges such as the Chicago Mercantile Exchange (CME). Standardisation ensures transparency, making it potentially easier for traders to open buy or sell positions. For example, a trader might use futures contracts to hedge against potential price movements in commodities or indices.
Over-the-Counter (OTC) Derivatives
OTC derivatives, including swaps and forwards and contracts for difference, are negotiated directly between two parties. These contracts are highly customisable but may carry more counterparty risk, as they aren't cleared through a central exchange. Institutions often use OTC derivatives for tailored solutions, such as managing interest rate fluctuations.
Strategies for Trading Derivatives
Traders typically employ derivatives for speculation or hedging. Speculation involves taking positions based on anticipated market movements, such as buying a CFD if prices are expected to rise. Hedging, on the other hand, can potentially mitigate losses in an existing portfolio by offsetting potential risks, like using currency swaps to protect against foreign exchange volatility.
Risk management plays a crucial role when trading derivatives. Understanding the underlying asset, monitoring market conditions, and using appropriate position sizes are vital to navigating their complexity.
CFD Trading
Contracts for Difference (CFDs) are among the most accessible derivative products for retail traders. They allow for speculation on price movements across a wide range of markets, including stocks, commodities, currencies, and indices, without owning the underlying asset. This flexibility makes CFDs an appealing option for individuals looking to diversify their strategies and explore global markets.
How CFDs Work
CFDs represent an agreement between the trader and the broker to exchange the difference in an asset's price between the opening and closing of a trade. If the price moves in the trader’s favour, the broker pays the difference; if it moves against them, the trader covers the loss. This structure is straightforward, allowing retail traders to trade in both rising and falling markets.
Why Retail Traders Use CFDs
Retail traders often gravitate towards CFDs due to their accessibility and unique features. CFDs allow leverage trading. By depositing a smaller margin, traders can gain exposure to much larger positions, potentially amplifying returns. However, you should remember that this comes with heightened risk, as losses are also magnified.
Markets and Opportunities
CFDs offer exposure to an extensive range of markets, including stocks, forex pairs, commodities, and popular indices like the S&P 500. Retail traders particularly appreciate the ability to trade these markets with minimal upfront capital, as well as the availability of 24/5 trading for many instruments. CFDs also enable traders to access international markets they might otherwise find difficult to trade, such as Asian or European indices.
Traders can explore a variety of CFDs with FXOpen.
Considerations for CFD Trading
While CFDs offer potential opportunities, traders must approach them cautiously. Leverage and high market volatility can lead to significant losses. Effective risk management in derivatives, meaning using stop-loss orders or limiting position sizes, can help traders potentially navigate these risks. Additionally, costs like spreads, commissions, and overnight fees can add up, so understanding the total cost structure is crucial.
Key Considerations When Trading Derivatives
Trading derivatives requires careful analysis and a clear understanding of the associated risks and potential opportunities.
Understanding the Underlying Asset
The value of a derivative depends entirely on its underlying asset, whether it’s a stock, commodity, currency, or index. Analysing the asset’s price behaviour, market trends, and potential volatility is crucial to identifying potential opportunities and risks.
Choosing the Right Derivative Product
Different derivatives serve different purposes. Futures might suit traders looking for exposure to commodities or indices, while CFDs provide accessible and potential opportunities for those seeking short-term price movements. Matching the derivative to your strategy is vital.
Managing Risk Effectively
Risk management plays a significant role in trading derivatives. Leverage can amplify both returns and losses, so traders often set clear limits on position sizes and overall exposure. Stop-loss orders and diversification are common ways to potentially reduce the impact of adverse market moves.
Understanding Costs
Trading derivatives involves costs like spreads, commissions, and potential overnight financing fees. These can eat into potential returns, especially for high-frequency or leveraged trades. A clear understanding of these expenses may help traders evaluate the effectiveness of their strategies.
Monitoring Market Conditions
Derivatives are sensitive to their underlying market changes, from geopolitical events to macroeconomic data. In stock derivatives, this might be company earning reports or sudden shifts in management. Staying informed helps traders adapt to shifting conditions and avoid being caught off guard by sudden price swings.
The Bottom Line
Financial derivatives are versatile tools for trading and hedging, offering potential opportunities to access global markets and diversify strategies. While their complexity demands a solid understanding, they can unlock significant potential for informed traders. Ready to explore derivatives trading? Open an FXOpen account today to trade CFDs on more than 700 assets with competitive costs, fast execution, and advanced trading tools. Good luck!
FAQ
What Is a Derivative?
The derivatives definition refers to a financial contract whose value is based on the performance of an underlying asset, such as stocks, commodities, currencies, or indices. Derivatives are financial instruments used to hedge risk, speculate on price movements, or access specific markets. Examples include futures, forwards, swaps, and contracts for difference (CFDs).
What Are the 4 Main Derivatives?
The primary categories of derivatives are futures, forwards, swaps, and contracts for difference (CFDs). Futures are commonly traded on exchanges, while forwards, swaps and CFDs are usually traded over-the-counter (OTC). Each serves different purposes, from risk management to speculative trading.
What Is the Derivatives Market?
The derivatives market is where financial derivatives are bought and sold. It includes regulated exchanges, like the Chicago Mercantile Exchange, and OTC markets where customised contracts are negotiated directly between parties. This market supports hedging, speculation, and risk transfer across global financial systems.
What Is the Difference Between Derivatives and Equities?
Equities signify ownership in a company, typically in the form of stock shares. Derivatives, on the other hand, are contracts that derive their value from the performance of an underlying asset, which can include equities. Unlike equities, derivatives do not confer ownership.
Is an ETF a Derivative?
No, an exchange-traded fund (ETF) is not a derivative. It is a fund that tracks a basket of assets, such as stocks or bonds, and trades like a stock. However, ETFs can use derivatives, such as futures, to achieve their investment objectives.
Is the S&P 500 a Derivative?
No, the S&P 500 is not a derivative. It is a stock market index that tracks the performance of 500 large companies listed in the US. Derivatives, like futures, can be created based on the S&P 500’s performance.
This article represents the opinion of the Companies operating under the FXOpen brand only. It is not to be construed as an offer, solicitation, or recommendation with respect to products and services provided by the Companies operating under the FXOpen brand, nor is it to be considered financial advice.

Soybean Futures Surge: ZS, ZL, and ZM Align for a Bullish MoveI. Introduction
Soybean futures are showing a potentially strong upcoming bullish momentum, with ZS (Soybean Futures), ZL (Soybean Oil Futures), and ZM (Soybean Meal Futures) aligning in favor of an upward move. The recent introduction of Micro Ag Futures by CME Group has further enhanced trading opportunities by allowing traders to manage risk more effectively while engaging with longer-term setups such as weekly timeframes.
Currently, all three soybean-related markets are displaying bullish candlestick patterns, accompanied by strengthening demand indicators. With RSI confirming upward momentum without entering overbought territory, traders are eyeing potential opportunities. Among the three, ZM appears to be the one which will potentially provide the greatest strength, showing resilience in price action and a favorable technical setup for a high reward-to-risk trade.
II. Technical Analysis of Soybean Markets
A closer look at the price action in ZS, ZL, and ZM reveals a confluence of bullish factors:
o Candlestick Patterns:
All three markets have printed bullish weekly candlestick formations, signaling increased buying interest.
o RSI Trends:
RSI is in an uptrend across all three contracts, reinforcing the bullish outlook.
Importantly, none of them are currently in overbought conditions, suggesting further upside potential.
o Volume Considerations:
Higher volume on up moves and decreasing volume on down-moves adds credibility to the bullish bias.
III. Comparative Price Action Analysis
While all three soybean-related markets are trending higher, their relative strength varies. By comparing recent weekly price action:
o ZM (Soybean Meal Futures) stands out as the one which will potentially become the strongest performer.
Last week, ZM closed above its prior weekly open, marking a +1.40% weekly gain.
RSI is not only trending higher but is also above its average, a sign of potential continued strength.
o ZS and ZL confirm bullishness but lag slightly in relative strength when compared to ZM.
This comparative analysis suggests that while all three markets are bullish, ZM presents the most compelling trade setup in terms of technical confirmation and momentum.
IV. Trade Setup & Forward-Looking Trade Idea
Given the strong technical signals, the trade idea focuses on ZM (Soybean Meal Futures) as the primary candidate.
Proposed Trade Plan:
Direction: Long (Buy)
Entry: Buy above last week’s high at 307.6
Target: UFO resistance at 352.0
Stop Loss: Below entry at approximately 292.8 (for a 3:1 reward-to-risk ratio)
Reward-to-Risk Ratio: 3:1
Additionally, with the introduction of Micro Ag Futures, traders can now fine-tune position sizing, making it easier to manage risk effectively on longer-term charts like the weekly timeframe. Given the novelty of such micro contracts, here is a CME resource that could be useful to understand their characteristics such as contracts specs .
V. Risk Management & Trade Discipline
Executing a trade plan is just one part of the equation—risk management is equally critical, especially when trading larger timeframes like the weekly chart. Here are key considerations for managing risk effectively:
1. Importance of Precise Entry and Exit Levels
Entering above last week’s high (307.6) ensures confirmation of bullish momentum before taking a position.
The target at 352.0 (UFO resistance) provides a well-defined profit objective, avoiding speculation.
A stop-loss at 292.8 is strategically placed to maintain a 3:1 reward-to-risk ratio, ensuring that potential losses remain controlled.
2. The Role of Stop Loss Orders & Hedging
A stop-loss prevents excessive drawdowns in case the market moves against the position.
Traders can also hedge using Micro Ag Futures to offset exposure while maintaining a bullish bias on the broader trend.
3. Avoiding Undefined Risk Exposure
The Micro Ag Futures contracts enable traders to scale into or out of positions without significantly increasing risk.
Position sizing should be adjusted based on account risk tolerance, ensuring no single trade overly impacts capital.
4. Adjusting for Market Volatility
Monitoring volatility using ATR (Average True Range) or other risk-adjusted indicators helps in adjusting stop-loss placement.
If volatility increases, a wider stop may be needed, but it should still align with a strong reward-to-risk structure.
Proper risk management ensures that trades are executed with discipline, preventing emotional decision-making and maximizing long-term trading consistency.
VI. Conclusion & Disclaimers
Soybean futures are showing bullishness, with ZS, ZL, and ZM aligning in favor of further upside. However, among them, ZM (Soybean Meal Futures) potentially exhibits the most reliable momentum, making it the prime candidate for a high-probability trade setup.
With bullish candlestick patterns, RSI trends confirming momentum, and volume supporting the move, traders have an opportunity to capitalize on this momentum while managing risk effectively using Micro Ag Futures.
When charting futures, the data provided could be delayed. Traders working with the ticker symbols discussed in this idea may prefer to use CME Group real-time data plan on TradingView: www.tradingview.com - This consideration is particularly important for shorter-term traders, whereas it may be less critical for those focused on longer-term trading strategies.
General Disclaimer:
The trade ideas presented herein are solely for illustrative purposes forming a part of a case study intended to demonstrate key principles in risk management within the context of the specific market scenarios discussed. These ideas are not to be interpreted as investment recommendations or financial advice. They do not endorse or promote any specific trading strategies, financial products, or services. The information provided is based on data believed to be reliable; however, its accuracy or completeness cannot be guaranteed. Trading in financial markets involves risks, including the potential loss of principal. Each individual should conduct their own research and consult with professional financial advisors before making any investment decisions. The author or publisher of this content bears no responsibility for any actions taken based on the information provided or for any resultant financial or other losses.

Options Blueprint Series [Intermediate]: Optimal Options StrikesI. Introduction
Options on futures offer traders a flexible way to participate in market movements while managing risk effectively. The Japanese Yen Futures (6J) market provides deep liquidity, making it a preferred instrument for options traders. In this article, we will explore how to optimize Bull Call Spreads in Yen Futures (6J) by understanding price equivalency and strike selection.
One of the most critical aspects of trading options on futures is recognizing that continuous futures charts and contract-specific charts display different prices. This discrepancy must be accounted for when setting up trade entries and exits. Additionally, strike price selection significantly impacts the reward-to-risk ratio, breakeven price, and probability of profitability.
By identifying key support and resistance levels (UFO), we will define trade setups that likely align with market structure, targeting precise entry and exit points. We will also compare different Bull Call Spread variations to understand how adjusting the strike selection impacts risk and potential reward.
II. Understanding the Japanese Yen Futures Contract
Before diving into the options strategy, it is essential to understand the specifications of the CME-traded Japanese Yen Futures (6J) contract:
Contract Size: Each futures contract represents 12,500,000 Japanese Yen
Tick Size: 0.0000005 USD per JPY (equivalent to $6.25 per tick)
Trading Hours: Nearly 24-hour trading cycle with short maintenance breaks
Margin Requirements: Currently $2,900 (varies through time).
For this article, we focus on December 2025 Yen Futures (6JZ2025). Since the market price displayed on continuous charts (6J1!) differs from contract-specific charts, we need to establish price equivalencies to align our trade analysis.
III. Price Equivalency Between Continuous and Contract-Specific Futures
Futures traders commonly use continuous charts (such as 6J1!) for analysis, but when trading options, it is crucial to reference the specific futures contract month (such as 6JZ2025). Due to roll adjustments and term structure variations, prices differ between these two charts.
In this setup, we identify key UFO-based support and resistance levels and adjust for contract-specific price equivalency:
Support Level Equivalency: 0.0066325 (6J1!) = 0.0068220 (6JZ2025)
Resistance Level Equivalency: 0.0069875 (6J1!) = 0.0072250 (6JZ2025)
These adjusted price levels ensure that the trade is structured accurately within the December 2025 contract, aligning option strikes with meaningful technical levels.
IV. The Bull Call Spread Strategy on Yen Futures
A Bull Call Spread is a vertical options spread strategy used to express a bullish outlook while reducing cost and limiting risk. This strategy involves:
Buying a lower-strike call (gaining upside exposure)
Selling a higher-strike call (reducing cost in exchange for capping maximum profit)
This setup provides a defined risk-reward structure and is particularly useful when targeting predefined resistance levels. Given that we identified 0.0068220 as support and 0.0072250 as resistance, we will structure multiple Bull Call Spreads to compare strike selection impact.
Now that the trade structure is established, let’s explore how different strike selections affect risk, reward, and breakeven prices.
V. Strike Selection and Its Impact on Risk-Reward Ratios
Selecting the appropriate strike prices is crucial when structuring a Bull Call Spread, as it directly affects the breakeven price, maximum risk, and maximum reward. To illustrate this, we compare three different Bull Call Spread variations using December 2025 Yen Futures (6JZ2025).
1. 0.00680/0.00720 Bull Call Spread
Breakeven: 0.006930
Maximum Risk: -0.00013
Maximum Reward: +0.00027
2. 0.00680/0.00750 Bull Call Spread
Breakeven: 0.0069789
Maximum Risk: -0.00018
Maximum Reward: +0.00052
3. 0.00680/0.00700 Bull Call Spread
Breakeven: 0.006879
Maximum Risk: -0.00008
Maximum Reward: +0.00012
Observing these variations, key insights emerge. The 0.00680/0.00750 spread offers the highest potential reward but comes with the highest breakeven and greater risk. Meanwhile, the 0.00680/0.00700 spread minimizes risk but provides a lower profit potential. Strike selection, therefore, becomes a balance between profitability potential and probability of success.
A wider spread (such as 0.00680/0.00750) has a higher reward-to-risk ratio, but it requires the price to move further before generating profits. Conversely, a narrower spread (like 0.00680/0.00700) has a lower breakeven price, increasing the probability of profitability but limiting potential upside.
VI. Trade Plan for a Bull Call Spread
Based on the analysis of strike selection, a balanced trade plan can be structured using the 0.00680/0.00720 Bull Call Spread, which offers a favorable reward-to-risk ratio while maintaining a reasonable breakeven price.
Market Bias: Bullish, expecting a move toward resistance
Selected Strikes: Long 0.00680 call, short 0.00720 call
Breakeven Price: 0.006930
Target Exit Price: 0.0072250
Maximum Risk: -0.00013
Maximum Reward: +0.00027
Reward-to-Risk Ratio: 2.08:1
This setup capitalizes on the previously identified UFO support to define the entry point, while the UFO resistance provides a target for exit. The breakeven price remains at a reasonable level, ensuring a greater probability of the spread moving into profitability.
VII. Risk Management Considerations
While the Bull Call Spread limits risk compared to outright long calls, proper risk management is still necessary. Traders should consider the following:
Using Stop-Loss Orders: If price breaks below the UFO support level at 0.0068220, traders may exit the position early to avoid excessive losses.
Hedging with Puts: If volatility spikes or market sentiment shifts, a put option or put spread can serve as a hedge against adverse movements.
Position Sizing: Adjusting contract size ensures that total exposure remains within acceptable risk limits based on account size.
Time Decay Considerations: Since time decay negatively impacts long call options, traders should monitor the spread's profitability as expiration approaches and adjust positions accordingly.
By implementing these risk management techniques, traders can optimize their Bull Call Spread strategy while mitigating unnecessary exposure.
When charting futures, the data provided could be delayed. Traders working with the ticker symbols discussed in this idea may prefer to use CME Group real-time data plan on TradingView: www.tradingview.com - This consideration is particularly important for shorter-term traders, whereas it may be less critical for those focused on longer-term trading strategies.
General Disclaimer:
The trade ideas presented herein are solely for illustrative purposes forming a part of a case study intended to demonstrate key principles in risk management within the context of the specific market scenarios discussed. These ideas are not to be interpreted as investment recommendations or financial advice. They do not endorse or promote any specific trading strategies, financial products, or services. The information provided is based on data believed to be reliable; however, its accuracy or completeness cannot be guaranteed. Trading in financial markets involves risks, including the potential loss of principal. Each individual should conduct their own research and consult with professional financial advisors before making any investment decisions. The author or publisher of this content bears no responsibility for any actions taken based on the information provided or for any resultant financial or other losses.

Leap Ahead with a Dynamic Setup: Trading with Andrew’s PitchforkThe Leap Trading Competition: A Chance to Trade Micro Euro Futures
TradingView’s "The Leap" Trading Competition provides an opportunity for traders to apply their futures trading strategies in a competitive environment. Participants can trade select CME Group futures contracts, including Micro Euro Futures (M6E).
This article presents a structured trade setup using Andrew’s Pitchfork, a technical tool that helps define potential trend direction and breakout levels. The setup involves two intersecting pitchforks near a key UFO support level, signaling the possibility of either an uptrend continuation or a confirmation of a new downtrend.
Understanding Andrew’s Pitchfork and Market Structure
Andrew’s Pitchfork is a technical analysis tool used to identify trend channels by plotting three parallel lines from a major price swing. The tool helps traders anticipate support, resistance, and breakout levels based on median lines.
In this setup, two pitchforks define opposing market structures. The green pitchfork represents an uptrend, suggesting that price could continue higher. The red pitchfork represents a developing downtrend, indicating a possible reversal. The intersection of these pitchforks at a key UFO support level marks an important decision point for the market.
The Dynamic Trade Setup: Long and Short Scenarios
In a long trade scenario, entry is confirmed if price breaks above the Upper Median Line (UML) of the red pitchfork. The target for the trade is the Median Line (ML) of the green pitchfork, representing trend continuation. A stop loss is placed below entry at a distance that ensures a minimum 3:1 reward-to-risk ratio.
In a short trade scenario, entry is confirmed if price breaks below the Lower Median Line (LML) of the green pitchfork. The target for the trade is the Median Line (ML) of the red pitchfork, confirming further downside movement. A stop loss is placed above entry at a distance that maintains a minimum 3:1 reward-to-risk ratio.
Because the UML, LML, and ML levels change dynamically with each bar, breakout levels and targets must be adjusted accordingly. If price remains inside the pitchfork structure, the setup remains neutral until confirmation occurs.
Contract Specifications and Margin Requirements
Euro FX Futures (6E) details:
Full contract specs: 6E Contract Specifications – CME Group
Contract size: €125,000
Tick size: 0.00005 per EUR/USD ($6.25 per tick)
Margin requirements depend on broker conditions and market volatility, currently around $2,600 per contract.
Micro EUR/USD Futures (M6E) details:
Full contract specs: M6E Contract Specifications – CME Group
Contract size: €12,500 (1/10th of 6E)
Tick size: 0.0001 per EUR/USD ($1.25 per tick)
Lower margin requirements provide access to traders with smaller accounts, currently around $260 per contract.
M6E offers a lower-cost alternative to 6E, making it a useful instrument for adjusting position sizes and managing risk effectively. Traders should consider market conditions and leverage when determining position sizes.
Execution and Trade Management
Before executing a trade, price must confirm a breakout by fully breaking above UML for long trades or below LML for short trades. Additional confirmation through volume trends, momentum indicators, or candlestick patterns may help validate the move.
If price does not confirm the breakout, the setup remains invalid. If price re-enters the pitchfork channel, traders should reassess market structure before taking a new position. Stop losses should be maintained at levels that align with a structured risk-reward plan.
Conclusion
Andrew’s Pitchfork provides a structured approach for trading trend continuation and reversals. This setup allows for both long and short breakout opportunities, depending on how price reacts at key pitchfork levels.
For traders in The Leap Trading Competition, this setup highlights the importance of disciplined execution, waiting for confirmation, and managing risk effectively when trading futures.
When charting futures, the data provided could be delayed. Traders working with the ticker symbols discussed in this idea may prefer to use CME Group real-time data plan on TradingView: www.tradingview.com - This consideration is particularly important for shorter-term traders, whereas it may be less critical for those focused on longer-term trading strategies.
General Disclaimer:
The trade ideas presented herein are solely for illustrative purposes forming a part of a case study intended to demonstrate key principles in risk management within the context of the specific market scenarios discussed. These ideas are not to be interpreted as investment recommendations or financial advice. They do not endorse or promote any specific trading strategies, financial products, or services. The information provided is based on data believed to be reliable; however, its accuracy or completeness cannot be guaranteed. Trading in financial markets involves risks, including the potential loss of principal. Each individual should conduct their own research and consult with professional financial advisors before making any investment decisions. The author or publisher of this content bears no responsibility for any actions taken based on the information provided or for any resultant financial or other losses.

Leap Ahead with a Dual Breakout Setup on ES and MESThe Leap Trading Competition: A Chance to Trade S&P 500 Futures
TradingView’s "The Leap" Trading Competition gives traders the opportunity to test their futures trading strategies in a competitive environment. Participants have access to select CME Group futures contracts, including E-mini S&P 500 Futures (ES) and Micro E-mini S&P 500 Futures (MES).
This article presents a dual breakout trade setup, analyzing both bullish and bearish scenarios based on key Fibonacci levels and low volatility price ranges. The goal is to trade the breakout of a well-defined range and target either a Fibonacci extension to the upside or a retracement level to the downside.
Understanding Breakouts and Fibonacci Levels
A breakout occurs when price moves beyond a defined support or resistance level, often leading to a strong trend continuation. In this case, the trading range between 6146.75 and 6121.25 is the key level to watch. A breakout above this range suggests bullish momentum, while a breakout below signals bearish pressure.
Fibonacci retracement levels are used to identify potential support or resistance zones based on past price movements. The 50% retracement level at 5985.75 aligns with a UFO support, making it a key downside target if price breaks lower.
Fibonacci extension levels project potential price targets beyond the most recent high or low. The 100% Fibonacci extension at 6288.75 serves as the projected upside target if price breaks higher.
The Dual Breakout Trade Setup
In a bullish scenario, a breakout above 6146.75 confirms entry to the upside. The target for this trade is the 100% Fibonacci extension at 6288.75. A stop loss is placed below the breakout level at a distance that ensures a minimum 3:1 reward-to-risk ratio.
In a bearish scenario, a breakdown below 6121.25 confirms entry to the downside. The target is the 50% Fibonacci retracement at 5985.75, which aligns with a UFO support zone. A stop loss is placed above the breakdown level, ensuring a minimum 3:1 reward-to-risk ratio.
Risk management considerations include adjusting stop losses based on a trader’s preferred risk-reward ratio. Scaling out at intermediate levels can help manage volatility and secure partial profits.
Contract Specifications and Margin Requirements
E-mini S&P 500 Futures (ES) details:
Full contract specs: ES Contract Specifications – CME Group
Contract size: $50 x S&P 500 Index
Tick size: 0.25 index points ($12.50 per tick)
Margin requirements depend on broker conditions and market volatility – Currently ≈$15,000 per contract.
Micro E-mini S&P 500 Futures (MES) details:
Full contract specs: MES Contract Specifications – CME Group
Contract size: $5 x S&P 500 Index (1/10th of ES)
Tick size: 0.25 index points ($1.25 per tick)
Lower margin requirements make it more accessible for smaller accounts – Currently ≈$1,500 per contract.
Leverage in ES and MES magnifies both potential gains and losses. Traders should consider margin requirements and market conditions when determining position sizes.
Execution and Market Conditions
Before executing a trade, a typical breakout trader would watch price confirm a breakout by sustaining above or below the key levels. Additional confirmation from volume trends and momentum indicators can improve trade accuracy.
If price does not break out, the setup remains invalid. If a false breakout occurs, traders may need to reassess conditions before re-entering.
Conclusion
A dual breakout setup provides both bullish and bearish opportunities depending on price movement. Fibonacci extensions provide upside targets, while retracement levels align with strong support zones for downside moves.
For participants in The Leap Trading Competition, this setup highlights the importance of disciplined execution, confirmation, and structured risk management.
When charting futures, the data provided could be delayed. Traders working with the ticker symbols discussed in this idea may prefer to use CME Group real-time data plan on TradingView: www.tradingview.com - This consideration is particularly important for shorter-term traders, whereas it may be less critical for those focused on longer-term trading strategies.
General Disclaimer:
The trade ideas presented herein are solely for illustrative purposes forming a part of a case study intended to demonstrate key principles in risk management within the context of the specific market scenarios discussed. These ideas are not to be interpreted as investment recommendations or financial advice. They do not endorse or promote any specific trading strategies, financial products, or services. The information provided is based on data believed to be reliable; however, its accuracy or completeness cannot be guaranteed. Trading in financial markets involves risks, including the potential loss of principal. Each individual should conduct their own research and consult with professional financial advisors before making any investment decisions. The author or publisher of this content bears no responsibility for any actions taken based on the information provided or for any resultant financial or other losses.

Leap Ahead with a Bearish Divergence on Gold FuturesThe Leap Trading Competition: A Chance to Trade Gold Futures
TradingView’s "The Leap" Trading Competition is an opportunity for traders to test their futures trading skills. Participants can trade select CME Group futures contracts, including Gold Futures (GC) and Micro Gold Futures (MGC).
Register and participate here: TradingView Competition Registration .
This article presents a structured short trade setup based on a bearish divergence identified using the Commodity Channel Index (CCI) and key pivot point levels for confirmation. The trade plan focuses on waiting for price to break below the pivot point at 2866.8 before executing the trade, with clear targets and risk management.
Identifying the Trade Setup
Bearish divergence occurs when price makes higher highs while an indicator, such as CCI, makes lower highs. This signals weakening momentum and a potential reversal. The Commodity Channel Index (CCI) measures price deviations from its average and helps traders identify overbought or oversold conditions.
Pivot points are calculated from previous price action and serve as key support and resistance levels. The pivot at 2866.8 is the reference level in this setup. A breakdown below this level may suggest further downside momentum, increasing the probability of a successful short trade.
The trade plan combines CCI divergence with pivot point confirmation. While divergence signals a potential shift, entry is only considered if price trades below 2866.8. This approach reduces false signals and improves trade accuracy. The first target is set at 2823.0, aligning with an intermediate support level (S1), while the final target is near S2 at 2776.2, just above a UFO support zone.
Trade Plan and Risk Management
The short trade is triggered only if price trades below 2866.8. The stop loss is placed above the entry at a level ensuring at least a 3:1 reward-to-risk ratio.
Profit targets are structured to lock in gains progressively:
The first exit is at 2823.0, where partial profits can be taken.
The final exit is near 2776.2, positioned just above a UFO support level.
Stop placement may vary based on the trader’s preferred risk-reward ratio. Position sizing should be adjusted according to account size and market volatility.
Contract Specifications and Margin Requirements
Gold Futures (GC) details:
Full contract specs: GC Contract Specifications – CME Group
Contract size: 100 troy ounces
Tick size: 0.10 per ounce ($10 per tick)
Margin requirements depend on broker conditions and market volatility. Currently around $12,500 per contract.
Micro Gold Futures (MGC) details:
Full contract specs: MGC Contract Specifications – CME Group
Contract size: 10 troy ounces (1/10th of GC)
Tick size: 0.10 per ounce ($1 per tick)
Lower margin requirements provide access to smaller traders. Currently around $1,250 per contract.
Leverage impacts both potential gains and losses. Traders should consider market conditions and margin requirements when adjusting position sizes.
Execution and Market Conditions
Before executing the trade, price must break below 2866.8. Additional confirmation can be sought through volume trends and price action signals.
If price does not break the pivot, the short setup is invalid. If price consolidates, traders should reassess momentum before committing to the trade.
Conclusion
Bearish CCI divergence signals potential market weakness, but confirmation from the pivot breakdown is key before executing a short trade. A structured approach with well-defined targets and risk management increases the probability of success.
For traders in The Leap Trading Competition, this setup highlights the importance of discipline, confirmation, and scaling out of trades to manage risk effectively.
When charting futures, the data provided could be delayed. Traders working with the ticker symbols discussed in this idea may prefer to use CME Group real-time data plan on TradingView: www.tradingview.com - This consideration is particularly important for shorter-term traders, whereas it may be less critical for those focused on longer-term trading strategies.
General Disclaimer:
The trade ideas presented herein are solely for illustrative purposes forming a part of a case study intended to demonstrate key principles in risk management within the context of the specific market scenarios discussed. These ideas are not to be interpreted as investment recommendations or financial advice. They do not endorse or promote any specific trading strategies, financial products, or services. The information provided is based on data believed to be reliable; however, its accuracy or completeness cannot be guaranteed. Trading in financial markets involves risks, including the potential loss of principal. Each individual should conduct their own research and consult with professional financial advisors before making any investment decisions. The author or publisher of this content bears no responsibility for any actions taken based on the information provided or for any resultant financial or other losses.

Behind the Curtain: Economic Forces Fueling Crude Oil Futures1. Introduction
Crude Oil Futures (CL), traded on the CME, are a cornerstone of global energy markets. Representing a vital benchmark for the energy sector, these futures reflect shifts in supply, demand, and macroeconomic sentiment. As both a speculative and hedging instrument, CL Futures are closely tied to economic forces shaping the global economy.
In this article, we leverage machine learning insights from a Random Forest Regressor to uncover the top economic indicators influencing Crude Oil Futures across daily, weekly, and monthly timeframes. By identifying these drivers, traders can gain a data-driven perspective to navigate the dynamic crude oil market effectively.
2. Understanding Crude Oil Futures
o Contract Specifications:
Standard Contract: Represents 1,000 barrels of crude oil.
Tick Size: Each tick is 0.01 per barrel, equating to $10 per tick per contract.
Trading Hours: Nearly 24 hours, ensuring global access and liquidity.
o Micro Crude Oil Contracts (MCL):
Contract Size: Represents 100 barrels of crude oil, 1/10th the size of the standard CL contract.
Tick Size: Each tick is 0.01 per barrel, equating to $1 per tick per contract.
Purpose: Offers smaller-scale traders’ access to the crude oil market with lower capital requirements, making it ideal for those looking to hedge or test strategies.
o Margins:
Standard CL Contract Margin: Approximately $6,000 per contract (subject to market volatility).
Micro MCL Contract Margin: Approximately $600 per contract.
The combination of high liquidity, leverage, and the flexibility offered by Micro Crude Oil contracts makes CL Futures a versatile choice for a broad range of participants, from institutional investors to retail traders exploring smaller-scale strategies.
3. Daily Timeframe: Key Economic Indicators
Machine learning insights reveal that the following daily indicators play a crucial role in shaping Crude Oil Futures' movements:
U.S. Trade Balance: Measures the difference between exports and imports. A narrowing trade deficit signals improved economic health and potential upward pressure on oil demand, while a widening deficit may indicate weakened economic sentiment, weighing on crude prices.
Unemployment Rate: Reflects labor market conditions and overall economic health. A declining unemployment rate often correlates with increased energy consumption due to stronger economic activity, boosting crude oil prices.
Building Permits: Tracks new residential construction permits issued. Rising permits reflect economic confidence and can signal increased energy demand for construction activity, providing upward momentum for crude prices.
4. Weekly Timeframe: Key Economic Indicators
Weekly indicators provide medium-term insights into crude oil market dynamics. The top drivers include:
Corporate Bond Spread (BAA - 10Y): Reflects the difference between corporate bond yields and Treasury yields. Widening spreads signal economic uncertainty, potentially reducing crude oil demand. Narrowing spreads suggest stability, supporting higher crude prices.
U.S. Trade Balance (again): At the weekly level, trade balance trends highlight the interplay between global trade and crude oil demand, influencing market sentiment over several days.
Housing Price Index: Indicates trends in real estate values, reflecting consumer confidence and economic stability. Rising housing prices often signal strong economic conditions, indirectly bolstering crude oil demand.
5. Monthly Timeframe: Key Economic Indicators
Monthly indicators provide a long-term perspective on Crude Oil Futures trends, highlighting macroeconomic forces at play. The top monthly drivers are:
Natural Gas Prices: As a competing energy source, fluctuations in natural gas prices can impact crude oil demand. Rising natural gas prices often lead to increased crude consumption, while declining prices may pressure oil demand downward.
U.S. Trade Balance (again): Over a monthly timeframe, the trade balance reflects sustained shifts in international trade dynamics. Persistent trade deficits may signal weaker global economic activity, affecting crude oil prices negatively, whereas trade surpluses may support demand.
Net Exports: A critical measure of a country’s export-import balance, net exports reveal global demand for domestic products, including crude oil. Surpluses suggest robust international demand, often leading to upward pressure on oil prices, while deficits indicate weaker sentiment.
6. Applications for Different Trading Styles
Economic indicators provide actionable insights tailored to specific trading styles:
Day Traders: Focus on daily indicators such as U.S. Trade Balance, Unemployment Rate, and Building Permits to anticipate intraday volatility. For example, an unexpected improvement in building permits might signal stronger economic activity, potentially boosting crude oil prices intraday.
Swing Traders: Weekly indicators like Corporate Bond Spread (BAA - 10Y) and Housing Price Index offer insights into intermediate trends. For instance, narrowing bond spreads often reflect economic stability, aligning with medium-term bullish positions in Crude Oil Futures.
Position Traders: Monthly indicators such as Natural Gas Prices and Net Exports are essential for capturing long-term macroeconomic shifts. Sustained increases in natural gas prices, for example, might support prolonged bullish sentiment in crude oil markets.
7. Risk Management Strategies
Risk management is crucial when trading Crude Oil Futures due to the inherent volatility of energy markets. Key strategies include:
Hedging Volatility: Utilize correlated assets, such as natural gas or refined product futures, to hedge against price swings.
Monitoring Leverage: Adjust position sizes based on volatility and margin requirements to minimize risk exposure during periods of heightened uncertainty.
Timeframe Diversification: Incorporate insights from daily, weekly, and monthly indicators to create a balanced trading approach. For example, while daily indicators may signal short-term volatility, monthly metrics provide stability for longer-term trades.
8. Conclusion
Crude Oil Futures are deeply influenced by economic indicators across varying timeframes. From the U.S. Trade Balance and Building Permits driving daily fluctuations to Natural Gas Prices and Net Exports shaping long-term trends, understanding these relationships is critical for navigating the energy market.
By leveraging data-driven insights from machine learning models, traders can align their strategies with market dynamics and improve decision-making. Whether you're a day trader, swing trader, or position trader, these economic forces offer a framework for more informed and strategic trading.
Stay tuned for the next installment in the "Behind the Curtain" series, where we unveil the economic forces shaping another critical futures market.
When charting futures, the data provided could be delayed. Traders working with the ticker symbols discussed in this idea may prefer to use CME Group real-time data plan on TradingView: www.tradingview.com - This consideration is particularly important for shorter-term traders, whereas it may be less critical for those focused on longer-term trading strategies.
General Disclaimer:
The trade ideas presented herein are solely for illustrative purposes forming a part of a case study intended to demonstrate key principles in risk management within the context of the specific market scenarios discussed. These ideas are not to be interpreted as investment recommendations or financial advice. They do not endorse or promote any specific trading strategies, financial products, or services. The information provided is based on data believed to be reliable; however, its accuracy or completeness cannot be guaranteed. Trading in financial markets involves risks, including the potential loss of principal. Each individual should conduct their own research and consult with professional financial advisors before making any investment decisions. The author or publisher of this content bears no responsibility for any actions taken based on the information provided or for any resultant financial or other losses.

Behind the Curtain: Top Economic Influencers on ZN Futures1. Introduction
The 10-Year Treasury Note Futures (ZN), traded on the CME, are a cornerstone of the fixed-income market. As a vital benchmark for interest rate trends and macroeconomic sentiment, ZN Futures attract institutional and retail traders alike. Their liquidity, versatility, and sensitivity to economic shifts make them a go-to instrument for both speculation and hedging.
In this article, we delve into the economic forces shaping ZN Futures’ performance across daily, weekly, and monthly timeframes. By leveraging machine learning, specifically a Random Forest Regressor, we identify the most impactful indicators influencing Treasury futures returns. These insights can help traders fine-tune their strategies and navigate the complexities of this market.
2. Product Specifications
Contract Size:
The standard ZN Futures contract represents $100,000 face value of 10-Year Treasury Notes.
Tick Size:
Each tick corresponds to 1/64 of 1% of par value. This equals $15.625 per tick, ensuring precise pricing and manageable risk for traders.
Margins:
Approximately $2,000 per contract (changes through time).
Micro Contract Availability:
While the standard contract suits institutional traders, the micro-sized Yield Futures provide a smaller-scale option for retail participants. These contracts offer reduced tick values and margin requirements, enabling broader market participation.
3. Daily Economic Drivers
Machine learning models reveal that daily fluctuations in ZN Futures are significantly influenced by the following indicators:
Building Permits: A leading indicator of housing market activity, an increase in permits signals economic confidence and growth. This optimism often puts upward pressure on yields, while a decline may reflect economic caution, boosting demand for Treasuries.
U.S. Trade Balance: This metric measures the difference between exports and imports. A narrowing trade deficit typically signals improved economic health, leading to higher yields. Conversely, a widening deficit can weaken economic sentiment, increasing Treasury demand as a safe-haven asset.
China GDP Growth Rate: As a global economic powerhouse, China’s GDP growth influences global trade and financial flows. Strong growth suggests robust international demand, pressuring Treasury prices downward as yields rise. Slower growth has the opposite effect, enhancing Treasury appeal.
4. Weekly Economic Drivers
When analyzing weekly timeframes, the following indicators emerge as significant drivers of ZN Futures:
Velocity of Money (M2): This indicator reflects the speed at which money circulates in the economy. High velocity signals robust economic activity, often putting upward pressure on yields. Slowing velocity, on the other hand, may indicate stagnation, increasing demand for Treasury securities.
Consumer Sentiment Index: This metric gauges the confidence level of consumers regarding the economy. Rising sentiment suggests stronger consumer spending and economic growth, often pressuring bond prices downward as yields rise. Conversely, a decline signals economic caution, favoring safe-haven assets like ZN Futures.
Nonfarm Productivity: This measures output per hour worked in the nonfarm sector and serves as an indicator of economic efficiency. Rising productivity typically reflects economic strength and may lead to higher yields, while stagnation or declines can shift sentiment toward Treasuries.
5. Monthly Economic Drivers
On a broader monthly scale, the following indicators play a pivotal role in shaping ZN Futures:
Net Exports: This metric captures the difference between a country’s exports and imports. A surplus indicates strong global demand for domestic goods, signaling economic strength and driving yields higher. Persistent deficits, however, may weaken economic sentiment and increase demand for Treasuries as a safe haven.
10-Year Treasury Yield: As a benchmark for longer-term borrowing costs, movements in the 10-Year Treasury Yield reflect investor expectations for economic growth and inflation. Rising yields suggest optimism about future economic conditions, potentially reducing demand for Treasury futures. Declining yields indicate caution, bolstering Treasury appeal.
Durable Goods Orders: This indicator measures new orders placed with manufacturers for goods expected to last three years or more. Rising orders signal business confidence and economic growth, often leading to higher yields. Conversely, a decline in durable goods orders can indicate slowing economic momentum, increasing Treasury demand.
6. Applications for Different Trading Styles
Economic indicators provide distinct insights depending on the trading style and timeframe:
Day Traders: Focusing on daily indicators like Building Permits, U.S. Trade Balance, and China GDP Growth Rate to anticipate short-term market movements. For example, an improvement in China’s GDP Growth Rate may signal stronger global economic conditions, potentially driving yields higher and pressuring ZN Futures lower.
Swing Traders: Weekly indicators such as Velocity of Money (M2), Consumer Sentiment Index, and Nonfarm Productivity could help identify intermediate trends. For instance, rising consumer sentiment can reflect increased spending expectations, potentially prompting bearish positions in ZN Futures.
Position Traders: Monthly metrics like Net Exports, 10-Year Treasury Yield, and Durable Goods Orders may offer a macro perspective for long-term strategies. A sustained increase in durable goods orders, for instance, may indicate economic expansion, influencing traders to potentially adopt bearish sentiment on ZN Futures.
7. Conclusion
The analysis highlights how daily, weekly, and monthly economic indicators collectively influence ZN Futures. From more immediate fluctuations driven by Building Permits and China GDP Growth Rate, to longer-term trends shaped by Durable Goods Orders and the 10-Year Treasury Yield, each timeframe provides actionable insights for traders.
By understanding these indicators and incorporating machine learning models to uncover patterns, traders can refine strategies tailored to specific time horizons. Whether intraday, swing, or long-term, leveraging these insights empowers traders to navigate ZN Futures with greater precision.
Stay tuned for the next installment in the "Behind the Curtain" series, where we examine economic drivers behind another key futures market.
When charting futures, the data provided could be delayed. Traders working with the ticker symbols discussed in this idea may prefer to use CME Group real-time data plan on TradingView: www.tradingview.com - This consideration is particularly important for shorter-term traders, whereas it may be less critical for those focused on longer-term trading strategies.
General Disclaimer:
The trade ideas presented herein are solely for illustrative purposes forming a part of a case study intended to demonstrate key principles in risk management within the context of the specific market scenarios discussed. These ideas are not to be interpreted as investment recommendations or financial advice. They do not endorse or promote any specific trading strategies, financial products, or services. The information provided is based on data believed to be reliable; however, its accuracy or completeness cannot be guaranteed. Trading in financial markets involves risks, including the potential loss of principal. Each individual should conduct their own research and consult with professional financial advisors before making any investment decisions. The author or publisher of this content bears no responsibility for any actions taken based on the information provided or for any resultant financial or other losses.

Behind the Curtain: Key Influencers of S&P 500 Futures Returns1. Introduction
The S&P 500 Futures (ES) represents one of the most actively traded futures contracts globally, serving as a benchmark for U.S. equity markets. Its liquidity and versatility make it a prime choice for traders seeking exposure to market movements. However, the factors driving these movements are far from random. Economic indicators often play a pivotal role in influencing the direction and volatility of S&P 500 Futures.
In this article, we dive into how various economic indicators shape the performance of S&P 500 Futures on daily, weekly, and monthly timeframes. Leveraging machine learning, specifically a Random Forest Regressor, we’ve identified the top drivers of these futures’ returns. The findings offer traders actionable insights to fine-tune their strategies and understand the broader market dynamics.
2. Understanding S&P 500 Futures
Product Specifications:
Tick Size: Each tick represents 0.25 index points, equivalent to $12.50 per tick.
Trading Hours: Nearly 24-hour trading cycle, ensuring liquidity across time zones.
Micro Contracts:
Micro E-mini S&P 500 Futures (MES): Designed for smaller-scale traders with a contract size 1/10th of the standard E-mini contract.
Advantages: Lower initial margin requirements and smaller tick values allow traders to manage positions more flexibly.
Margin Requirements:
Initial and maintenance margins vary based on volatility and market conditions. Currently around $15,500 per contract.
Micro contracts offer significantly lower margin requirements, making them ideal for retail traders or those testing strategies. Currently around $1,550 per contract.
3. Key Economic Indicators Influencing S&P 500 Futures
Daily Impacts:
1. Labor Force Participation Rate:
Reflects the percentage of the working-age population that is employed or actively seeking employment.
A rise in this rate often signals economic optimism, driving equities higher.
2. Building Permits:
Tracks the number of new residential construction permits issued.
A strong rise in permits indicates confidence in the housing market, which can positively
influence broader economic sentiment and equities.
3. Initial Jobless Claims:
A leading indicator of labor market health, providing real-time insights into layoffs.
Weekly fluctuations can significantly impact intraday futures trading.
Weekly Impacts:
1. Corporate Bond Spread (BAA - 10Y):
A measure of credit risk in the economy, reflecting the difference between corporate bond yields and Treasury yields.
Widening spreads often signal economic uncertainty, weighing on equity markets.
2. Velocity of Money (M2):
Represents the rate at which money circulates in the economy.
High velocity can indicate economic expansion, while slowing velocity may suggest stagnation, affecting equity futures trends.
3. Net Exports:
Tracks the balance of a country’s exports and imports.
Positive trends often boost market optimism, whereas persistent deficits can trigger concerns about economic health.
Monthly Impacts:
1. Oil Import Price Index:
Reflects the cost of imported crude oil, which has ripple effects on production costs across industries.
Rising oil import prices may pressure corporate earnings, impacting the broader S&P 500 index.
2. PPI: Processed Foods and Feeds:
Tracks price changes in processed agricultural products, offering insights into supply chain pressures.
Sharp increases can hint at inflationary risks, influencing long-term equity market sentiment.
3. Consumer Sentiment Index:
o Measures consumer confidence, a leading indicator of economic health.
o High sentiment often signals robust consumer spending, which supports equities.
4. Applications for Different Trading Styles
Day Traders:
Focus on daily indicators like Initial Jobless Claims and Labor Force Participation Rate.
Example: A sudden drop in jobless claims could signal short-term economic strength, providing day traders with bullish opportunities.
Swing Traders (Weekly):
Leverage weekly trends like Corporate Bond Spread or Velocity of Money (M2).
Example: A narrowing bond spread might indicate improving business confidence, aligning with medium-term bullish positions.
Position Traders (Monthly):
Use monthly indicators such as Oil Import Price Index and Consumer Sentiment Index to identify macroeconomic trends.
Example: Rising consumer sentiment could indicate a stronger economy, supporting long-term bullish strategies in S&P 500 Futures.
5. Risk Management Through Indicator Analysis
Refining Entry and Exit Points: Use indicator data to align trades with anticipated market shifts. For instance, an uptick in the Oil Import Price Index might signal upcoming headwinds for equities.
Managing Leverage: Understanding the volatility drivers like Treasury Yields can help traders adjust position sizes to manage risk effectively.
Diversification Across Timeframes: Incorporate insights from multiple timeframes to hedge risks. For example, while short-term indicators may suggest volatility, long-term metrics can provide stability signals.
Hedging Strategies: Use correlated assets or options to mitigate downside risks. Combining economic indicator analysis with market seasonality can enhance portfolio resilience.
6. Conclusion
Economic indicators provide invaluable insights into the drivers of S&P 500 Futures, helping traders align their strategies with market trends. Whether focusing on daily volatility from indicators like Initial Jobless Claims or broader monthly trends such as the Consumer Sentiment Index, understanding these relationships can enhance trading decisions.
By leveraging machine learning and data-driven analysis, this article highlights how indicators shape market movements across various timeframes. The insights empower traders to adopt tailored approaches—whether intraday, swing, or long-term—while improving risk management practices.
This framework not only applies to S&P 500 Futures but can also be extended to other markets. Stay tuned for the next article in the "Behind the Curtain" series, where we explore another futures market and its relationship with key economic indicators.
When charting futures, the data provided could be delayed. Traders working with the ticker symbols discussed in this idea may prefer to use CME Group real-time data plan on TradingView: www.tradingview.com - This consideration is particularly important for shorter-term traders, whereas it may be less critical for those focused on longer-term trading strategies.
General Disclaimer:
The trade ideas presented herein are solely for illustrative purposes forming a part of a case study intended to demonstrate key principles in risk management within the context of the specific market scenarios discussed. These ideas are not to be interpreted as investment recommendations or financial advice. They do not endorse or promote any specific trading strategies, financial products, or services. The information provided is based on data believed to be reliable; however, its accuracy or completeness cannot be guaranteed. Trading in financial markets involves risks, including the potential loss of principal. Each individual should conduct their own research and consult with professional financial advisors before making any investment decisions. The author or publisher of this content bears no responsibility for any actions taken based on the information provided or for any resultant financial or other losses.

Behind the Curtain: Economic Indicators Shaping Corn Futures1: Introduction
Corn Futures (ZC), traded on the CME, play a vital role in global markets, particularly in the agriculture and food industries. As a commodity with widespread applications, Corn Futures are influenced by a multitude of factors, ranging from seasonal weather patterns to broader economic trends. Understanding these influences is critical for traders seeking to navigate the market effectively.
In this article, we leverage machine learning, specifically a Random Forest Regressor, to identify key economic indicators that have historically correlated with Corn Futures' price changes. By analyzing daily, weekly, and monthly timeframes, we aim to provide a clearer picture of how these indicators potentially shape market behavior and offer actionable insights for traders.
The findings are presented through visual graphs highlighting the top economic indicators across different timeframes. These insights can help traders fine-tune their strategies, whether for short-term speculation or long-term investment.
2: Understanding the Key Economic Indicators
Economic indicators provide a glimpse into various facets of the economy, influencing commodity markets such as Corn Futures. Using the Random Forest model, the following indicators emerged as significant for Corn Futures on different timeframes:
Daily Timeframe:
Oil Import Price Index: Reflects the cost of importing crude oil, impacting energy costs in agriculture, such as fuel for equipment and transportation.
Durable Goods Orders: Tracks demand for goods expected to last three years or more, often signaling broader economic activity that can influence commodity demand.
Natural Gas Prices: Critical for the production of fertilizers, which directly impacts corn farming costs.
Weekly Timeframe:
China GDP Growth Rate: Indicates global demand trends, as China is a major consumer of agricultural products.
Housing Starts: Reflects construction activity, indirectly influencing economic stability and consumer behavior.
Corporate Bond Spread (BAA - 10Y): A measure of credit risk that can signal changes in business investment and economic uncertainty.
Monthly Timeframe:
Retail Sales (YoY): Gauges consumer spending trends, a crucial driver of demand for corn-based products.
Initial Jobless Claims: Acts as a measure of labor market health, influencing disposable income and consumption patterns.
Nonfarm Productivity: Indicates economic efficiency and growth, impacting broader market trends.
By understanding these indicators, traders can interpret their implications on Corn Futures more effectively.
3: How to Use This Information
The timeframes for these indicators provide unique perspectives for different trading styles:
Daily Traders: Indicators like the Oil Import Price Index and Natural Gas Prices, which are highly sensitive to short-term changes, are valuable for high-frequency trading strategies. Daily traders can monitor these to anticipate intraday price movements in Corn Futures.
Swing Traders (Weekly): Weekly indicators, such as the China GDP Growth Rate or Housing Starts, help identify intermediate-term trends. Swing traders can align their positions with these macroeconomic signals for trades lasting several days or weeks.
Long-Term Traders (Monthly): Monthly indicators, such as Retail Sales and Nonfarm Productivity, provide insights into overarching economic trends. Long-term traders can use these to assess demand-side factors impacting Corn Futures over extended periods.
Additionally, traders can enhance their strategies by overlaying these indicators with seasonal patterns in Corn Futures, as weather-related supply shifts often coincide with economic factors.
4: Applications for Risk Management
Understanding the relationship between economic indicators and Corn Futures also plays a critical role in risk management. Here are several ways to apply these insights:
Refining Entry and Exit Points: By correlating Corn Futures with specific indicators, traders can potentially time their entries and exits more effectively. For example, a sharp rise in the Oil Import Price Index might signal increased production costs, potentially pressuring corn prices downward.
Diversifying Trading Strategies: Leveraging daily, weekly, and monthly indicators allows traders to adapt their strategies across timeframes. Short-term volatility from energy prices can complement long-term stability signals from broader economic metrics like GDP Growth.
Mitigating Uncertainty: Tracking indicators such as Corporate Bond Spreads can provide early warnings of economic instability, helping traders hedge their Corn Futures positions with other assets or options.
Seasonal Hedging: Combining indicator-based insights with seasonal trends in Corn Futures can enhance risk-adjusted returns. For instance, aligning hedging strategies with both economic and weather-related factors could reduce downside exposure.
5: Conclusion
The analysis highlights how diverse economic indicators shape Corn Futures prices across multiple timeframes. From daily volatility influenced by energy costs to long-term trends driven by consumer spending and productivity, each indicator provides unique insights into market dynamics.
Traders can use this framework not only for Corn Futures but also for other commodities, enabling a more data-driven approach to trading. The combination of machine learning and economic analysis presents opportunities to refine strategies and improve outcomes in the competitive world of futures trading.
Stay tuned for the next article in this series, where we delve into another futures market and its relationship with key economic indicators.
When charting futures, the data provided could be delayed. Traders working with the ticker symbols discussed in this idea may prefer to use CME Group real-time data plan on TradingView: www.tradingview.com - This consideration is particularly important for shorter-term traders, whereas it may be less critical for those focused on longer-term trading strategies.
General Disclaimer:
The trade ideas presented herein are solely for illustrative purposes forming a part of a case study intended to demonstrate key principles in risk management within the context of the specific market scenarios discussed. These ideas are not to be interpreted as investment recommendations or financial advice. They do not endorse or promote any specific trading strategies, financial products, or services. The information provided is based on data believed to be reliable; however, its accuracy or completeness cannot be guaranteed. Trading in financial markets involves risks, including the potential loss of principal. Each individual should conduct their own research and consult with professional financial advisors before making any investment decisions. The author or publisher of this content bears no responsibility for any actions taken based on the information provided or for any resultant financial or other losses.

Currency Wars: Exploring BTC/Fiat Ripple Effects on Key Markets1. Introduction
In today's interconnected financial markets, major fiat currencies like the Euro (6E) and Yen (6J) play a critical role in influencing USD-denominated assets. The relative strength between these currencies often reflects underlying economic trends and risk sentiment, which ripple across key markets like Treasuries (ZN), Gold (GC), and Equities (ES).
However, Bitcoin (BTC), a non-traditional digital asset, introduces an interesting divergence. Unlike fiat currencies, BTC's behavior during periods of significant market stress may reveal a unique relationship to USD movements. This article explores:
The relative strength between the Euro and Yen.
Correlations between fiat currencies, BTC, and USD-denominated markets.
Whether BTC reacts similarly or differently to traditional currencies during market volatility.
By analyzing these dynamics, we aim to identify how shifts in currency strength influence assets like Treasuries while assessing BTC’s independence or alignment with fiat markets.
2. Relative Strength Between 6E and 6J
To evaluate currency dynamics, we compute the relative strength of the Euro (6E) versus the Yen (6J) as a ratio. This ratio helps identify which currency is outperforming, providing insights into broader risk sentiment and market direction.
Another way to think of this ratio would be to use the RY1! Ticker symbol which represents the Euro/Japanese Yen Futures contract.
Correlation Heatmaps
The correlation heatmaps below highlight relationships between:
o Currencies: Euro (6E), Yen (6J), and Bitcoin (BTC).
o USD-Denominated Markets: Treasuries (ZN), S&P 500 (ES), Crude Oil (CL), Gold (GC), and Corn (ZC).
o Key Observations (Daily Timeframe):
The 6J (Yen) shows a positive correlation with Treasuries (ZN), supporting its traditional role as a safe-haven currency.
Bitcoin (BTC) demonstrates mixed relationships across assets, showing signs of divergence compared to fiat currencies during specific conditions.
o Key Observations (Weekly and Monthly Timeframes):
Over longer timeframes, correlations between 6E and markets like Gold (GC) strengthen, while the Yen's (6J) correlation with Treasuries becomes more pronounced.
BTC correlations remain unstable, suggesting Bitcoin behaves differently than traditional fiat currencies, particularly in stress periods.
3. BTC Divergence: Behavior During Significant Moves
To assess BTC's behavior during stress periods, we identify significant moves (beyond a predefined threshold) in the Euro (6E) and Yen (6J). Using scatter plots, we plot BTC returns against these currency moves:
BTC vs 6E (Euro):
BTC returns show occasional alignment with Euro movements but also exhibit non-linear patterns. For instance, during sharp Euro declines, BTC has at times remained resilient, highlighting its decoupling from fiat.
BTC vs 6J (Yen):
BTC's reaction to Yen strength/weakness appears more random, lacking a clear pattern. This further underscores BTC’s independence from traditional fiat dynamics, even as Yen strength typically aligns with safe-haven asset flows.
The scatter plots reveal that while fiat currencies like the Euro and Yen maintain consistent relationships with USD-denominated markets, Bitcoin exhibits periods of divergence, particularly during extreme stress events.
4. Focus on Treasury Futures (ZN)
Treasury Futures (ZN) are among the most responsive assets to currency shifts due to their role as a safe-haven instrument during economic uncertainty. Treasury prices often rise when risk aversion drives investors to seek safer assets, particularly when fiat currencies like the Yen (6J) strengthen.
6E/6J Influence on ZN
From the correlation heatmaps:
The Yen (6J) maintains a positive correlation with ZN prices, particularly during periods of market stress.
The Euro (6E) exhibits a moderate correlation, with fluctuations largely dependent on economic events affecting Eurozone stability.
When relative strength shifts in favor of the Yen (6J) over the Euro (6E), Treasury Futures often attract increased demand, reflecting investor flight-to-safety dynamics.
Forward-Looking Trade Idea
Given the above insights, here’s a hypothetical trade idea focusing on 10-Year Treasury Futures (ZN):
Trade Direction: Long Treasury Futures to capitalize on potential safe-haven flows.
Entry Price: 109’29
Target Price: 111’28
Stop Loss: 109’09
Potential for Reward: 126 ticks = $1,968.75
Potential for Risk: 40 ticks = $625
Reward-to-Risk Ratio: 3.15:1
Tick Value: 1/2 of 1/32 of one point (0.015625) = $15.625
Required margin: $2,000 per contract
This trade setup anticipates ZN’s upward momentum if the Yen continues to outperform the Euro or if broader risk-off sentiment triggers demand for Treasuries.
5. Risk Management Importance
Trading currency-driven assets like Treasury Futures or Bitcoin requires a disciplined approach to risk management due to their volatility and sensitivity to macroeconomic shifts. Key considerations include:
a. Stop-Loss Orders:
Always use stop-loss levels to limit downside exposure, especially when markets react sharply to currency moves or unexpected news.
b. Position Sizing:
Adjust position size to match market volatility.
c. Monitor Relative Strength:
Continuously track the 6E/6J ratio to identify shifts in currency strength that could signal changes in safe-haven flows or BTC behavior.
d. Non-Correlated Strategies:
Incorporate BTC into portfolios as a non-correlated asset, especially when fiat currencies exhibit linear correlations with traditional markets.
By implementing proper risk management techniques, traders can navigate the ripple effects of currency moves on markets like Treasuries and Bitcoin.
6. Conclusion
The relative strength between the Euro (6E) and Yen (6J) provides critical insights into the broader market environment, particularly during periods of stress. As shown:
Treasury Futures (ZN): Highly sensitive to Yen strength due to its safe-haven role.
Bitcoin (BTC): Demonstrates unique divergence from fiat currencies, reinforcing its role as a non-traditional asset during volatility.
By analyzing correlations and BTC’s reaction to currency moves, traders can better anticipate opportunities in USD-denominated markets and identify divergence points that signal market shifts.
When charting futures, the data provided could be delayed. Traders working with the ticker symbols discussed in this idea may prefer to use CME Group real-time data plan on TradingView: www.tradingview.com - This consideration is particularly important for shorter-term traders, whereas it may be less critical for those focused on longer-term trading strategies.
General Disclaimer:
The trade ideas presented herein are solely for illustrative purposes forming a part of a case study intended to demonstrate key principles in risk management within the context of the specific market scenarios discussed. These ideas are not to be interpreted as investment recommendations or financial advice. They do not endorse or promote any specific trading strategies, financial products, or services. The information provided is based on data believed to be reliable; however, its accuracy or completeness cannot be guaranteed. Trading in financial markets involves risks, including the potential loss of principal. Each individual should conduct their own research and consult with professional financial advisors before making any investment decisions. The author or publisher of this content bears no responsibility for any actions taken based on the information provided or for any resultant financial or other losses.

Timeframes and Correlations in Multi-Asset Markets1. Introduction
Understanding correlations across timeframes is essential for traders and investors managing diverse portfolios. Correlations measure how closely the price movements of two assets align, revealing valuable insights into market relationships. However, these relationships often vary based on the timeframe analyzed, with daily, weekly, and monthly perspectives capturing unique dynamics.
This article delves into how correlations evolve across timeframes, explores their underlying drivers, and examines real-world examples involving multi-asset instruments such as equities, bonds, commodities, and cryptocurrencies. By focusing on these key timeframes, traders can identify meaningful trends, manage risks, and make better-informed decisions.
2. Timeframe Aggregation Effect
Correlations vary significantly depending on the aggregation level of data:
Daily Timeframe: Reflects short-term price movements dominated by noise and intraday volatility. Daily correlations often show weaker relationships as asset prices react to idiosyncratic or local factors.
Weekly Timeframe: Aggregates daily movements, smoothing out noise and capturing medium-term relationships. Correlations tend to increase as patterns emerge over several days.
Monthly Timeframe: Represents long-term trends influenced by macroeconomic factors, smoothing out daily and weekly fluctuations. At this level, correlations reflect systemic relationships driven by broader forces like interest rates, inflation, or global risk sentiment.
Example: The correlation between ES (S&P 500 Futures) and BTC (Bitcoin Futures) may appear weak on a daily timeframe due to high BTC volatility. However, their monthly correlation might strengthen, aligning during broader risk-on periods fueled by Federal Reserve easing cycles.
3. Smoothing of Volatility Across Timeframes
Shorter timeframes tend to exhibit lower correlations due to the dominance of short-term volatility and market noise. These random fluctuations often obscure deeper, more structural relationships. As the timeframe extends, volatility smooths out, revealing clearer correlations between assets.
Example:
ZN (10-Year Treasuries) and GC (Gold Futures) exhibit a weaker correlation on a daily basis because they react differently to intraday events. However, over monthly timeframes, their correlation strengthens due to shared drivers like inflation expectations and central bank policies.
By aggregating data over weeks or months, traders can focus on meaningful relationships rather than being misled by short-term market randomness.
4. Market Dynamics at Different Frequencies
Market drivers vary depending on the asset type and the timeframe analyzed. While short-term correlations often reflect immediate market reactions, longer-term correlations align with broader economic forces:
Equities (ES - S&P 500 Futures): Correlations with other assets are driven by growth expectations, earnings reports, and investor sentiment. These factors fluctuate daily but align more strongly with macroeconomic trends over longer timeframes.
Cryptocurrencies (BTC - Bitcoin Futures): Highly speculative and volatile in the short term, BTC exhibits weak daily correlations with traditional assets. However, its monthly correlations can strengthen with risk-on/risk-off sentiment, particularly in liquidity-driven environments.
Safe-Havens (ZN - Treasuries and GC - Gold Futures): On daily timeframes, these assets may respond differently to specific events. Over weeks or months, correlations align more closely due to shared reactions to systemic risk factors like interest rates or geopolitical tensions.
Example: During periods of market stress, ZN and GC may show stronger weekly or monthly correlations as investors seek safe-haven assets. Conversely, daily correlations might be weak as each asset responds to its unique set of triggers.
5. Case Studies
To illustrate the impact of timeframes on correlations, let’s analyze a few key asset relationships:
o BTC (Bitcoin Futures) and ES (S&P 500 Futures):
Daily: The correlation is typically weak (around 0.28) due to BTC’s high volatility and idiosyncratic behavior.
Weekly/Monthly: During periods of broad market optimism, BTC and ES may align more closely (0.41), reflecting shared exposure to investor risk appetite.
o ZN (10-Year Treasuries) and GC (Gold Futures):
Daily: These assets often show weak or moderate correlation (around 0.39), depending on intraday drivers.
Weekly/Monthly: An improved correlation (0.41) emerges due to their mutual role as hedges against inflation and monetary uncertainty.
o 6J (Japanese Yen Futures) and ZN (10-Year Treasuries):
Daily: Correlation moderate (around 0.53).
Weekly/Monthly: Correlation strengthens (0.74) as both assets reflect broader safe-haven sentiment, particularly during periods of global economic uncertainty.
These case studies demonstrate how timeframe selection impacts the interpretation of correlations and highlights the importance of analyzing relationships within the appropriate context.
6. Conclusion
Correlations are not static; they evolve based on the timeframe and underlying market drivers. Short-term correlations often reflect noise and idiosyncratic volatility, while longer-term correlations align with structural trends and macroeconomic factors. By understanding how correlations change across daily, weekly, and monthly timeframes, traders can identify meaningful relationships and build more resilient strategies.
The aggregation of timeframes also reveals diversification opportunities and risk factors that may not be apparent in shorter-term analyses. With this knowledge, market participants can better align their portfolios with prevailing market conditions, adapting their strategies to maximize performance and mitigate risk.
When charting futures, the data provided could be delayed. Traders working with the ticker symbols discussed in this idea may prefer to use CME Group real-time data plan on TradingView: www.tradingview.com - This consideration is particularly important for shorter-term traders, whereas it may be less critical for those focused on longer-term trading strategies.
General Disclaimer:
The trade ideas presented herein are solely for illustrative purposes forming a part of a case study intended to demonstrate key principles in risk management within the context of the specific market scenarios discussed. These ideas are not to be interpreted as investment recommendations or financial advice. They do not endorse or promote any specific trading strategies, financial products, or services. The information provided is based on data believed to be reliable; however, its accuracy or completeness cannot be guaranteed. Trading in financial markets involves risks, including the potential loss of principal. Each individual should conduct their own research and consult with professional financial advisors before making any investment decisions. The author or publisher of this content bears no responsibility for any actions taken based on the information provided or for any resultant financial or other losses.
