Stock Market Logic Series #1The purpose of this series is to provide insight into what price is likely to do...
and more vital... what price is not likely to do... (since X is the cause and X is not existing, hence Y will not happen...)
The chart is self-explanatory.
IF no-one cares about the stock THEN no one will put money into it (no volume) THEN it will not rise.
The BIG question is, at a certain overextended place, the price is rising, even though, everyone is at a loss on this stock. why NOT crush into a price of $1 in one sharp move?
Can we "KNOW" that we are in an overextended place?
When you have stock market logic behind you, you will be more confident to take trades.
Overextended
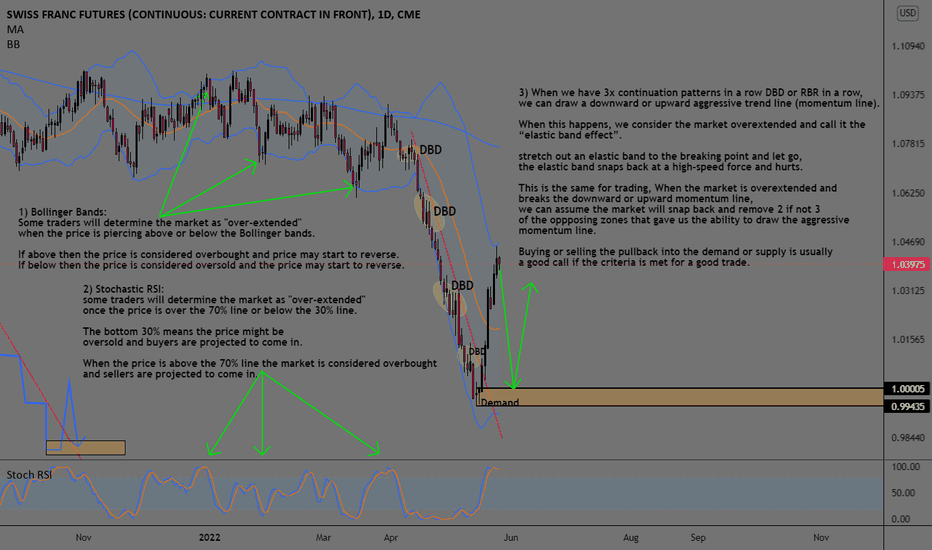
Overextended Markets (Overbought And Oversold)1) Bollinger Bands:
Some traders will determine the market as "over-extended"
when the price is piercing above or below the Bollinger bands.
If above then the price is considered overbought and price may start to reverse.
If below then the price is considered oversold and the price may start to reverse.
2) Stochastic RSI:
some traders will determine the market as "over-extended" once the price is over the 70% line or below the 30% line.
The bottom 30% means the price might be oversold and buyers are projected to come in.
When the price is above the 70% line the market is considered overbought and sellers are projected to come in.
3) Supply And demand
When we have 3x continuation patterns in a row DBD or RBR in a row, we can draw a downward or upward aggressive trend line (momentum line).
When this happens, we consider the market overextended and call it the “elastic band effect”.
stretch out an elastic band to the breaking point and let go, the elastic band snaps back at a high-speed force and hurts.
This is the same for trading, When the market is overextended and breaks the downward or upward momentum line, we can assume the market will snap back and remove 2 if not 3 of the opposing zones that gave us the ability to draw the aggressive momentum line.
Buying or selling the pullback into the demand or supply is usually a good call if the criteria are met for a good trade.
Looking for a short This stock gain 13.33% yesterday and now i think its a bit over extended at this point, looking for a short between the range of $4.83 and $4.64.
Looking for a short GMA is overextended from yesterday, got rejected at $4.09 and close ten cents below. I have gather data for the past 249 days and the mean of this stock -0.23% with a median of -0.38% stating there is more negative days then positive. Also with Kurtosis its 9 and the skew 0.02 as well, this data just gives me more information about my short basis. Looking to short between $4.03 and $3.87 and 1 standard deviation is 77%.
Looking for a shortWSP had a massive run up yesterday, gaining over 10%. I love seeing when a stock is overextended it just gives me more reason to short it, the mean of WSP is -0.19% so there more negative days than positive. Based on the data its a normal standard deviation of 68%, therefore im looking to trade between $2.19 and $1.78, lets see how it reacts between $2.060 and $1.92.
looking for a short FNP looks way overextended on daily, it gain just over 10% yesterday without any news. Look for a potential short, my trading range will be between $5.96 and $5.65.
Happy Trading


